Figure 5.
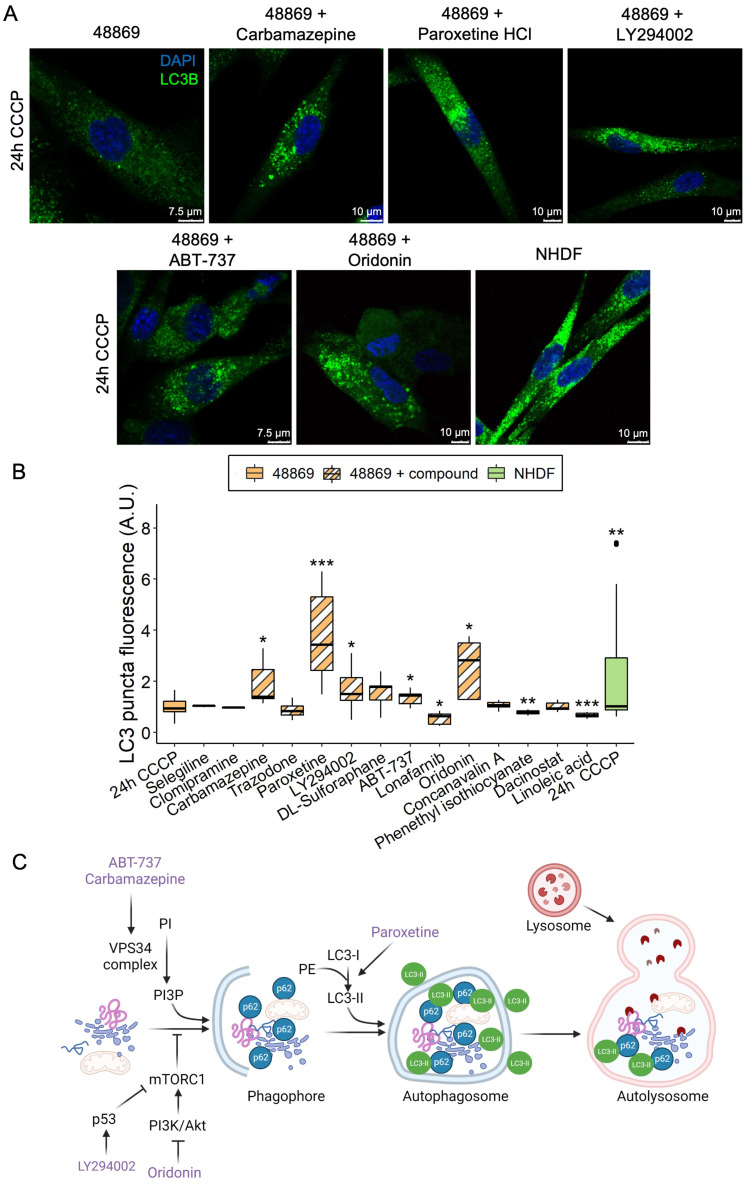
LC3 puncta levels in C19orf12D18G/L132Q fibroblasts treated with autophagy-modulating compounds. Representative confocal images of C19orf12D18G/L132Q fibroblasts treated for 24 h with 20 µM CCCP only and with CCCP plus each of the five hit compounds (carbamazepine, paroxetine, LY294002, ABT-737, and oridonin). The green signal indicates LC3; the blue signal (DAPI), nuclei (A). Box plots refer to LC3 puncta fluorescence levels normalized per number of cells in NHDF and C19orf12D18G/L132Q fibroblasts (48869) treated with 20 µM CCCP alone and C19orf12D18G/L132Q fibroblasts treated with CCCP plus autophagy modulating compounds. Quantification of LC3 puncta fluorescence was performed using ImageJ. n = 10 cells from each of the n = 6 independent experiments were considered for the quantification. Data were analyzed with unpaired two-tailed t-tests; * p < 0.05, ** p < 0.01, *** p < 0.001 (B). Schematic representation of the entry point of each hit compound in the autophagy flux. The picture was created using BioRender (C).

