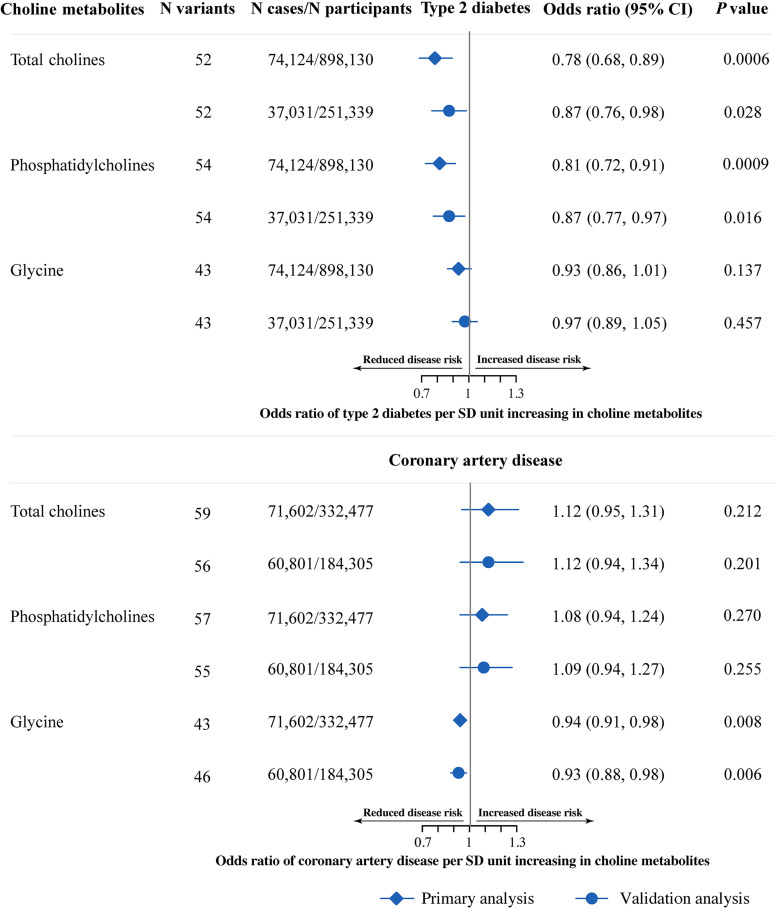
Figure 3.
Causal effect of choline metabolites on T2D and CAD. The OR and 95% CI indicate the effect estimates of decrease in T2D and CAD risk per SD unit of each choline metabolite with use of the IVW method. The T2D data were from the DIAGRAM consortium in the primary analysis (diamonds) and FinnGen study in the validation analysis (dots). The CAD data were from a meta-GWAS of CARDIoGRAMplusC4D and UK Biobank in the primary analysis (diamonds), and CARDIoGRAMplusC4D only in the validation analysis (dots).

