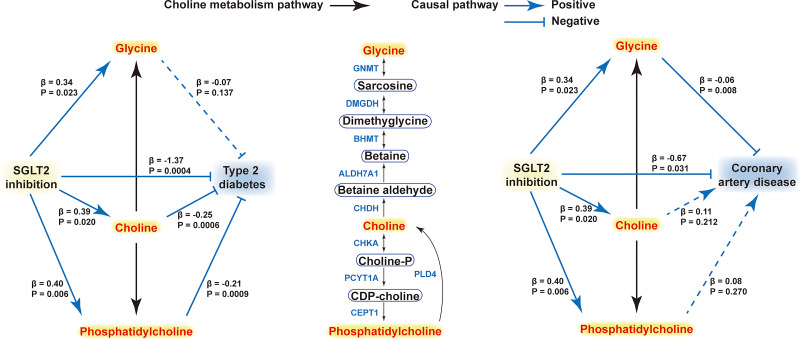
Figure 5.
Summary integrating the causal evidence from MR with the biological evidence from the pathway and PPI analysis. The diagram includes the choline metabolism pathway (middle) and causal pathways of SGLT2 inhibition–metabolites–diseases. In choline metabolism pathway, single-side arrows indicate nonreversible reactions and double-side arrows indicate reversible reactions. In causal pathways, the arrows and T-shaped lines labeled with corresponding enzymes beside signify positive and negative associations, respectively, in which the solid lines indicate significant causality and dotted lines nonsignificant. The β-values are the MR estimates. GNMT, glycine N-methyltransferase; BHMT, betaine-homocysteine S-methyltransferase; CEPT1, choline/ethanolamine phosphotransferase 1; CHDH, choline dehydrogenase; CHKA, choline kinase α; DMGDH, dimethylglycine dehydrogenase; ALDH7A1, aldehyde dehydrogenase 7 family member A1; PCYT1A, phosphate cytidylyltransferase 1A; PLD4, phospholipase D family member 4.

