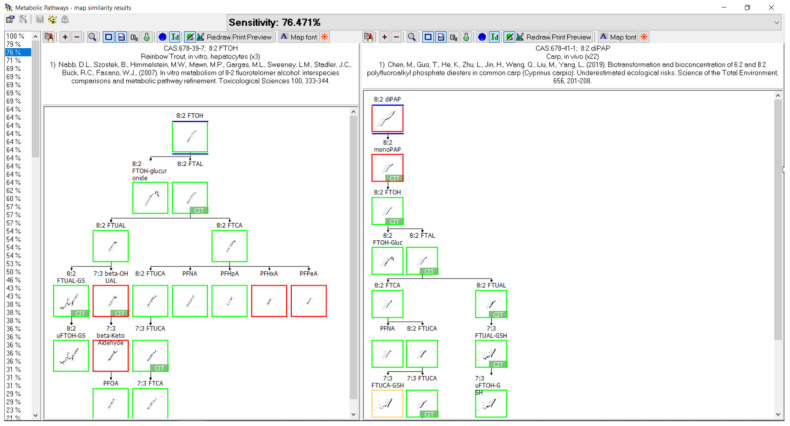
Figure 19.
Metabolic map comparison of (left) 8:2 FTOH in rainbow trout hepatocytes and (right) 8:2 diPAP in vivo carp. Metabolites common to both species are indicated by green boxes. Differences in metabolites are indicated by red boxes. Tan boxes indicate phase II conjugates. Sensitivity, in this case 76.471%, is an assessment of the map comparison whereby the number of common metabolites is divided by the total number of metabolites in the fish map. Metabolites labeled with CIT are presumed intermediates in the path but were not identified in the study.

