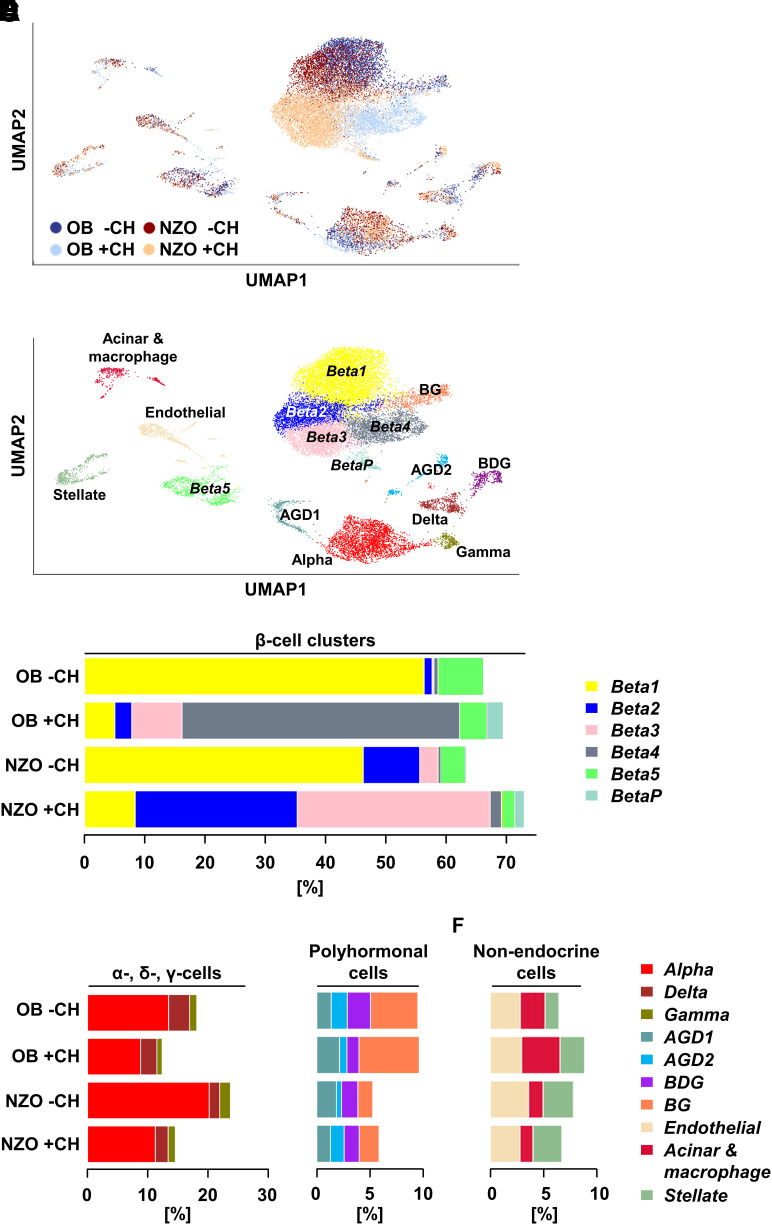
Figure 1.
Changes in β-cell subpopulations in response to a 2-day diabetogenic stimulus markedly differ in diabetes-resistant OB and diabetes-prone NZO mice. A: UMAP plot of all 19,440 islet cells from OB −CH (blue dots), OB +CH (lilac dots), NZO −CH (orange dots), and NZO +CH (red dots) mice. Islet cells from n = 3 mice per group were pooled and used for scRNA-Seq. B: UMAP plot of all cells from the four groups with indicated cell clusters. Multihormonal cell clusters were designated by the presence of markers for α-cells (A), β-cells (B), γ-cells (G), and/or δ-cells (D). C: Bar plots showing the percentage of cells belonging to a specific β-cell cluster in OB and NZO islets under −CH or +CH feeding. Percentages of α-, δ-, and γ-cells (D) as well as polyhormonal (E) and nonendocrine (F) cells in pancreatic islets of the indicated groups.

