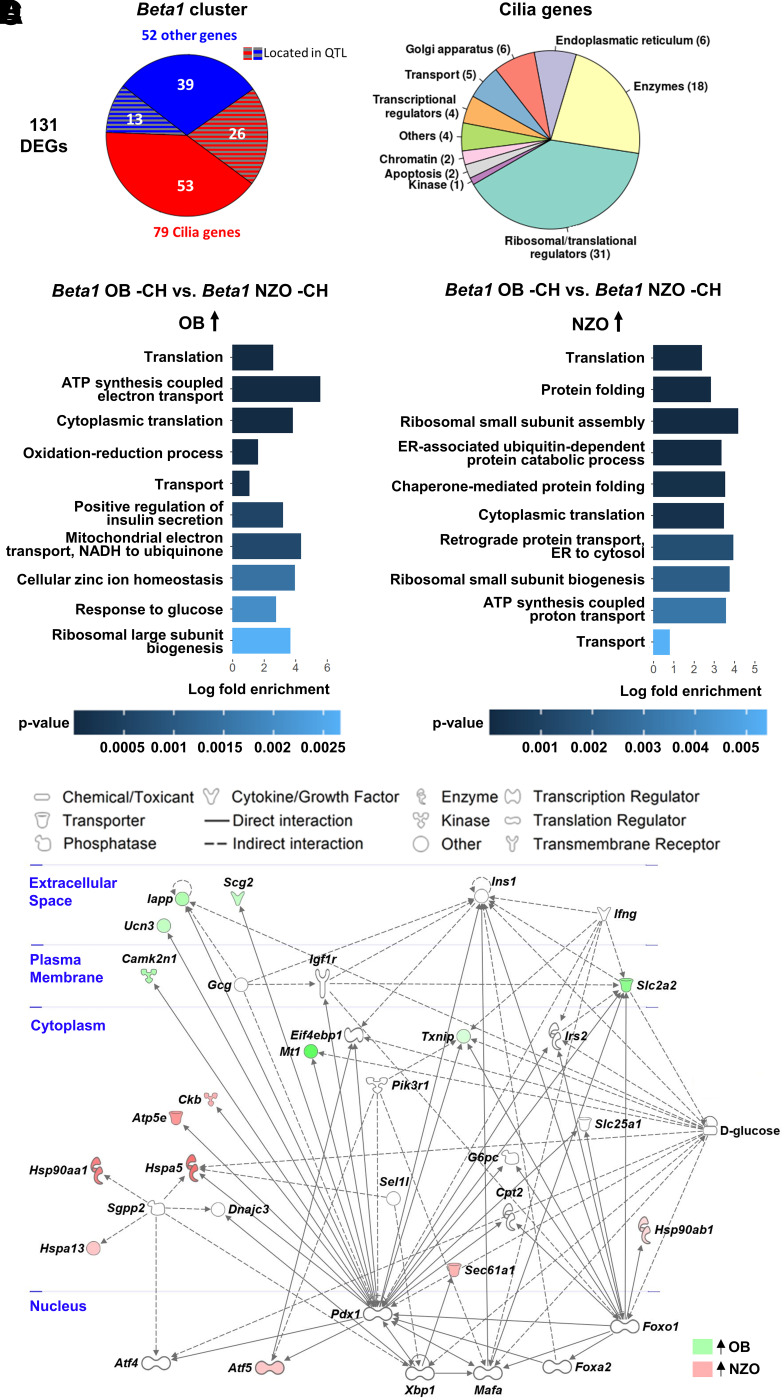
Figure 2.
Differential expression of cilia-annotated and PDX1-regulated genes between OB- and NZO mice in the carbohydrate-free β-cell cluster Beta1. A: Annotation of the 131 genes differentially expressed between Beta1 cells of OB and NZO mice by cellular location and process. The DEGs were separated into cilia-annotated genes and remaining genes based on the Cildb database. B and C: Top 10 regulated GO terms (biological process) of DEGs from the comparison of OB −CH Beta1 vs. NZO −CH Beta1 cells. Shown are biological processes upregulated in OB (B) or NZO (C) mice. Absolute log (fold change) > 0.2; FDR < 0.01. D: Network analysis of 131 genes differentially expressed between Beta1 cells of OB and NZO −CH mice. Data were analyzed via Ingenuity Pathway Analysis. Cellular localization of gene products is shown in blue.

