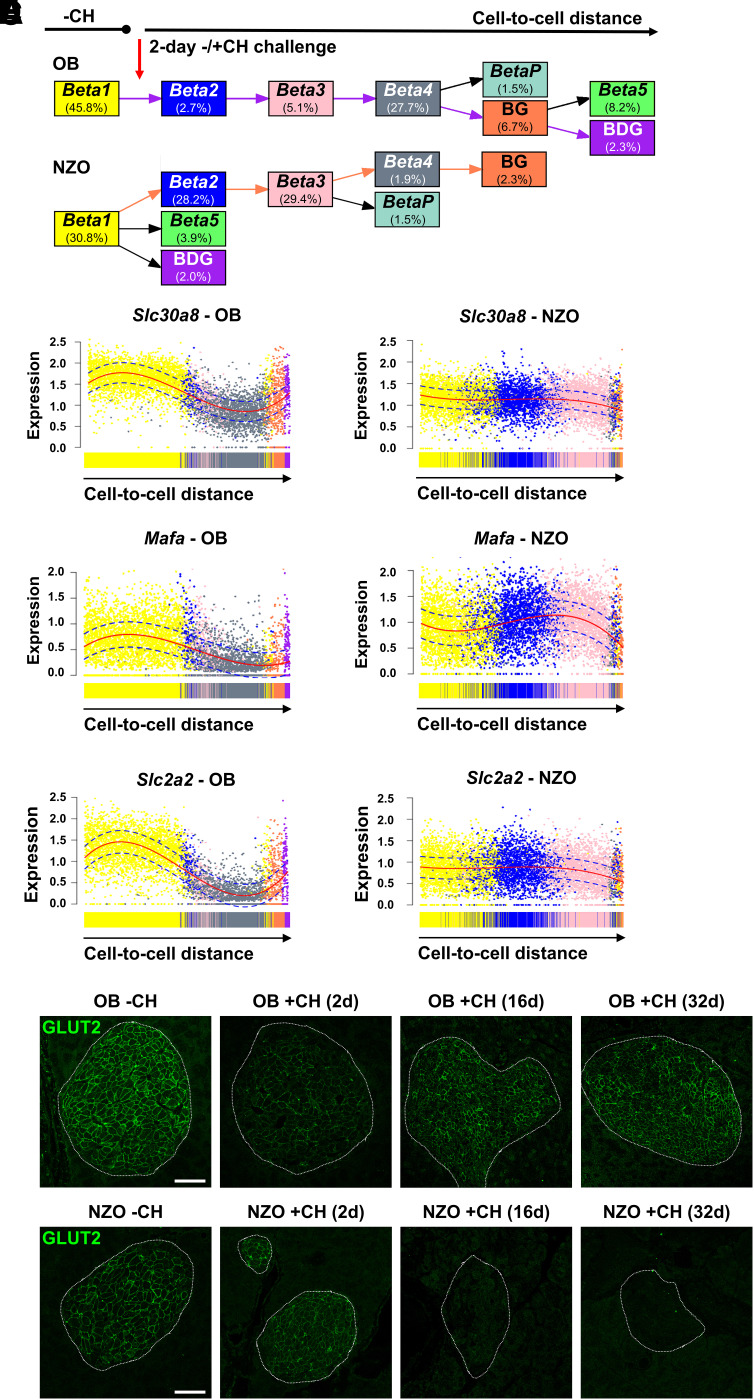
Figure 3.
Trajectories of β-cell clusters in OB and NZO in response to 2-day carbohydrate feeding. A: Pseudotime analysis using slingshot shows predicted trajectories of OB and NZO β-cells based on cell-to-cell distance. The percentage of cells in the different clusters is depicted in the respective boxes. The trajectory from Beta1 to BDG in OB is highlighted with purple arrows and the Beta1 to BG trajectory in NZO with orange arrows. B–D: Expression levels of Slc30a8 (B), Mafa (C), and Slc2a2 (D) along those trajectories highlighted in A. Dots represent scaled expression levels of individual β-cells color coded according to their cluster allocation. Solid red lines depict fitted curves, and dotted blue lines depict CIs. E and F: Representative images of GLUT2 (green) staining in pancreatic sections of OB (E) and NZO (F) mice fed a −CH or +CH diet for 2, 16, or 32 days. After 16 and 32 days, GLUT2-positive signals were nearly undetectable in NZO islets, whereas a transient reduction in OB islets at 2 days with +CH was reversed at the later time points. Scale bar, 50 µm. d, days.

