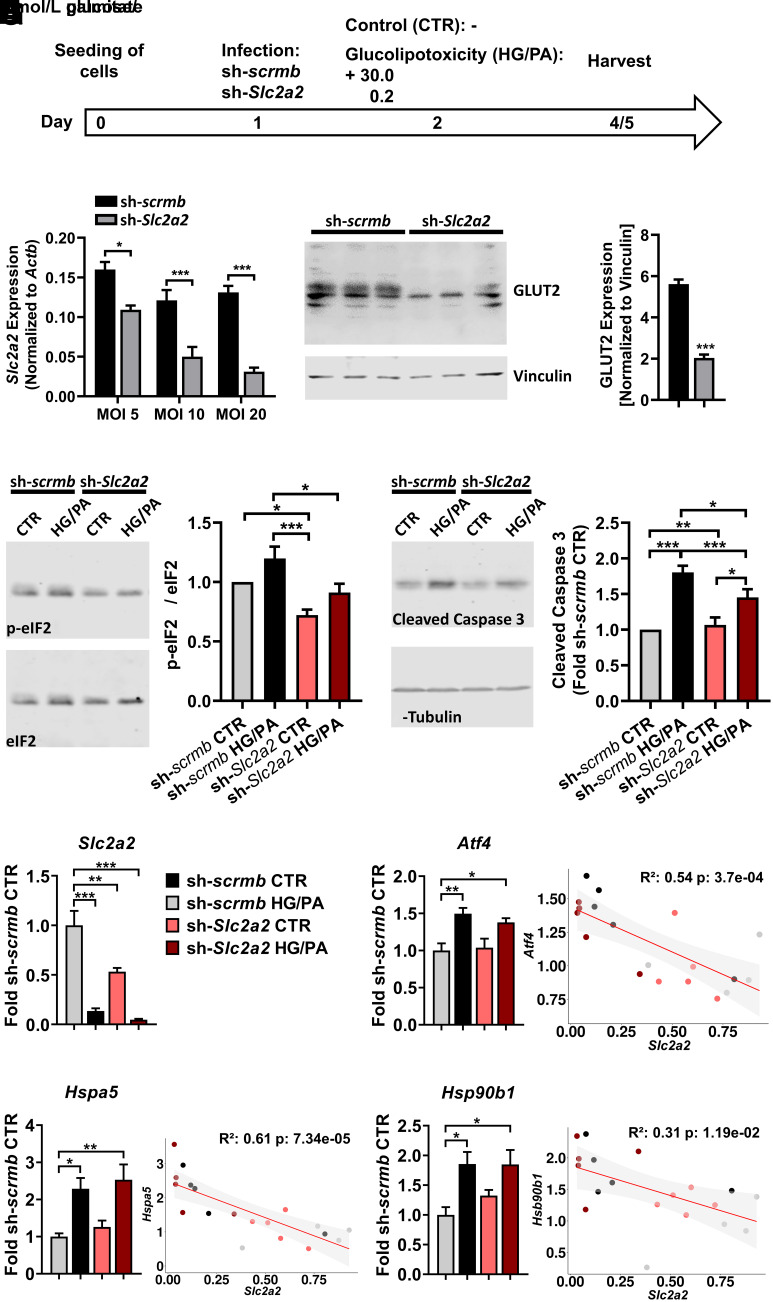
Figure 4.
Downregulation of GLUT2 in β-cells ameliorates glucolipotoxic effects. A: INS-1 823/13 (INS-1) cells or dispersed C57BL/6J islets were infected with adenovirus containing scrambled (sh-scrmb) or GLUT2-specific (sh-Slc2a2) shRNA and incubated without (CTR) or with 30 mmol/L glucose and 0.2 mmol/L palmitate (HG/PA) for 2–3 days. B: Successful downregulation of GLUT2 mRNA at different viral loads (n = 4) (one-way ANOVA). C: Representative Western blot of GLUT2 in INS-1 cells infected with sh-scrmb or sh-Slc2a2 (MOI 20) (left panel) and quantification of GLUT2 levels (right panel) (n = 3, Welch t test). D: Representative immunoblots of phospho-eIF2α and total eIF2α in sh-scrmb or sh-Slc2a2–infected INS-1 cells (MOI 20) (left panel) and quantification of phospho-eIF2α levels relative to total eIF2α (right panel) (n = 8, two-way ANOVA). E: Representative immunoblot of cleaved caspase 3 in sh-scrmb or sh-Slc2a2–infected INS-1 cells (MOI 20) (left panel) and quantification of cleaved caspase 3 levels relative to α-tubulin (right panel) (n = 12, two-way ANOVA). F–I: Quantification of gene expression via quantitative PCR in dispersed C57BL/6J islets infected with sh-scrmb or sh-Slc2a2 (MOI 20). Slc2a2 expression (F) was correlated with levels of Atf4 (G), Hspa5 (H), and Hsp90b1 (I). Data are presented as mean ± SEM (*P ≤ 0.05; **P ≤ 0.01; ***P ≤ 0.001). p-, phosphorylated.

