Figure 6.
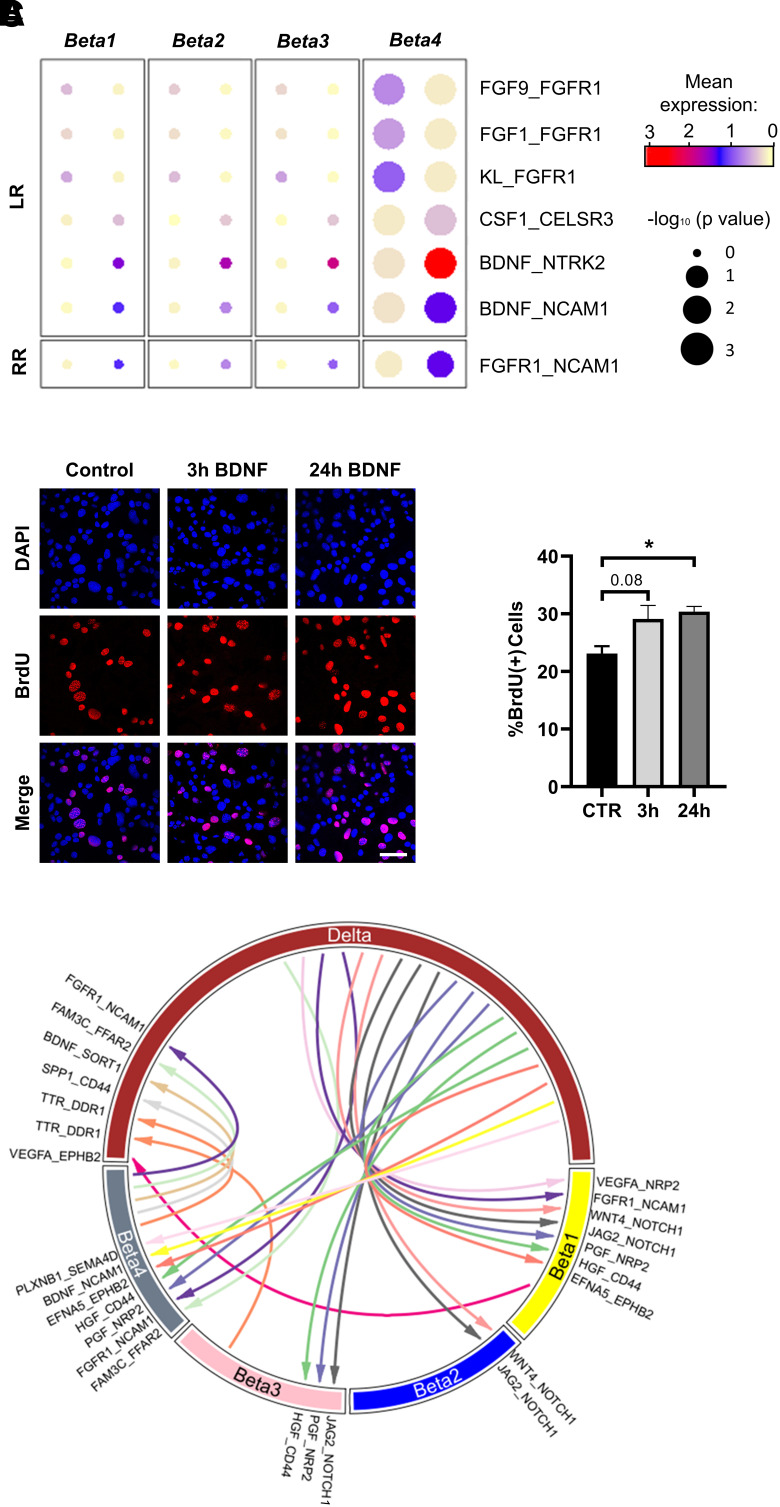
Analysis of islet cell-cell communication based on ligand and receptor gene expression. A: Dot plots representing potential ligand-receptor (LR) and receptor-receptor (RR) interactions in Beta1–4 cells and upregulated in Beta4. B: Induction of proliferation in MIN6 β-cells via exposure to BDNF. Serum-starved MIN6 cells were treated with BDNF for 3 or 24 h. Subsequently, BrdU was added for 2 h, followed by fixation and immunostaining with a BrdU antibody (left panel). Quantification of BrdU-positive MIN6 cells shown as percentage of DAPI-positive nuclei (right panel) (n = 3). C: Circle plot depicting potential intercellular communication (based on ligand-receptor gene expression) in δ-cells and β-cell clusters Beta1–4. Arrow directions are from ligand to receptor. Nonunique interactions more likely to occur between δ-cells and all four β-cell clusters are not shown. CTR, control.

