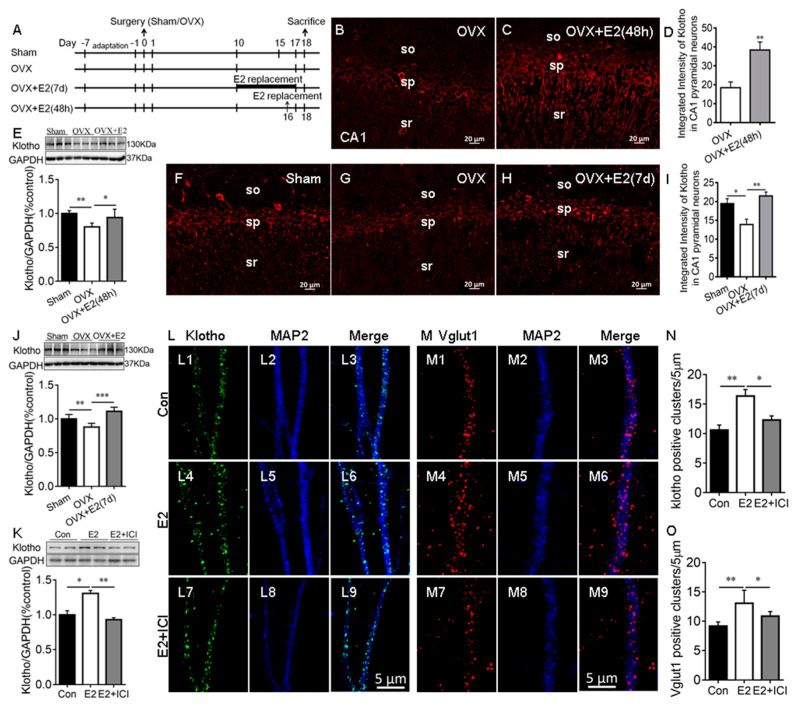
Figure 1.
E2 increased Klotho expression in the hippocampus of ovariectomized (OVX) rats and cultured hippocampal neurons. Experimental design (A). Representative images of KL immunostaining (red) in the hippocampal CA1 area of sham, OVX, and E2-treated OVX (OVX + E2) rats (48 h after vehicle or E2 injection (B,C); daily vehicle or E2 injection for 7 days (F–H)). Quantification of fluorescence intensity of KL staining in the hippocampal CA1 area (48 h (D); 7 d (I)). Western blot showing the relative KL protein levels in the hippocampus of sham, OVX, and OVX + E2 rats (48 h (E); 7 d (J); n = 6). The cultures were treated with the vehicle (Con), 10 nM E2, and E2 + 1 μM ICI (ICI182,780, estrogen receptor inhibitor) at Div13 for 48 h. Western blot result of hippocampal lysate prepared from primary hippocampal culture (K). Immunostaining of cultured hippocampal neurons with antibodies specific to KL and MAP2 in Con, E2, and E2 + ICI neurons (L). KL staining (green, (L1,L4,L7)), MAP2 staining (blue, (L2,L5,L8)), and merge of KL and MAP2 (L3,L6,L9). Quantification of KL-positive clusters in cultured hippocampal neurons (N). Immunostaining of cultured hippocampal neurons with antibodies specific to Vglut1 and MAP2 in Con, E2, and E2 + ICI neurons (M). Vglut1 staining (red, (M1,M4,M7)), MAP2 staining (blue, (M2,M5,M8)), and merge of Vglut1 and MAP2 (M3,M6,M9). The number of Vglut1-positive clusters in cultured hippocampal neurons (O). SO, stratum oriens of CA1 area; SP, stratum pyramidale of CA1 area; SR, stratum radiatum of CA1 area; Con, control. Data are shown as the mean ± SEM. D with the t-test, and others with one-way ANOVA followed by Tukey’s test. * p < 0.05, ** p < 0.01, *** p < 0.001.

