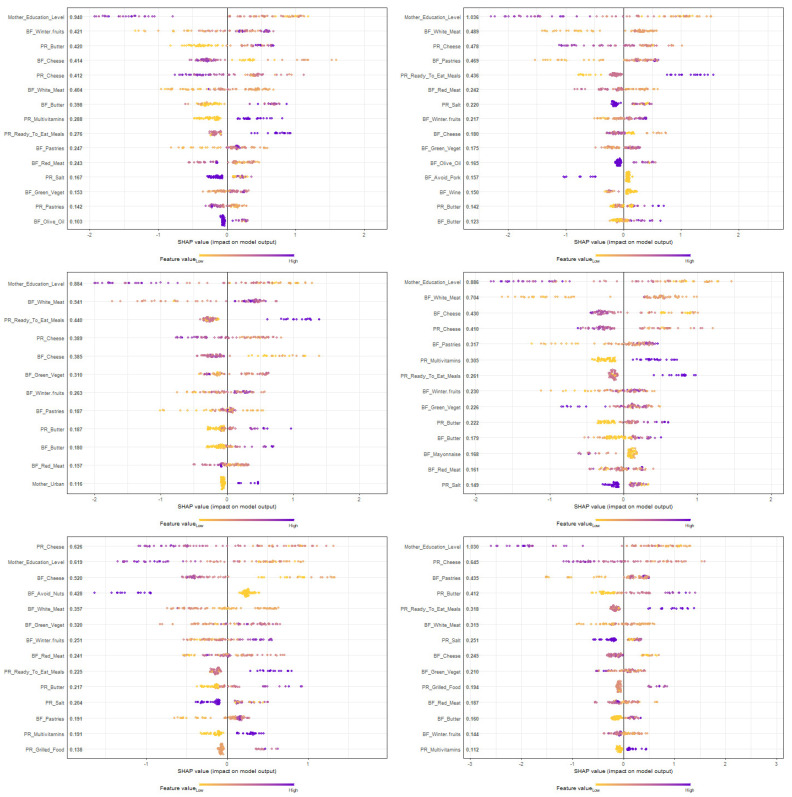
Figure 3.
Prediction of the age of tolerance acquisition of infants with food protein-induced allergic proctocolitis (FPIAP): SHAP plot of the testing phase of the XGBoost classifier: one separate plot per fold of the 6-fold cross validation process of testing. PR: Pregnancy; BF: Breastfeeding; Green_Veget: Green Vegetables. Predictor values are symbolized with colors from low to high. Using the SHAP diagrams, we evaluate the association, positive or negative, between each predictor and the target class. According to the SHAP diagrams, once the purple-to-blue dots per variable fall mostly on the left side, they favor group A, while once they fall on the right side, they favor group B, confirming the findings from the univariate analysis.

