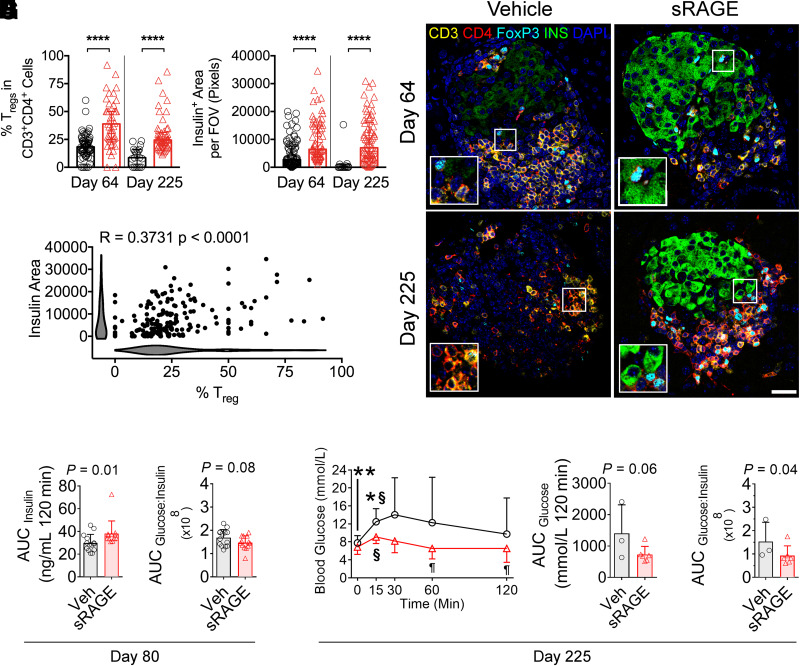
Figure 4.
Improvements in islet-infiltrating Tregs, insulin expression, and oral glucose tolerance following sRAGE treatment in NOD/ShiLt mice. A–D: Multiplexed immunofluorescence staining and quantification of CD3, CD4, FoxP3, insulin, and DAPI (n = 10–20 sections/mouse from n = 6 mice/group). Inset images are ×2 magnified. A: Proportion of islet-infiltrating CD3+CD4+FoxP3+ Tregs. B: Insulin area per field of view (FOV). C: Representative photomicrographs. Bar, 40 µm. D: Correlation analyses of CD3+CD4+FoxP3+ Treg proportions and insulin area (shaded bars are Kernel plots showing variable distribution). E–I: OGTTs on day 80 (n = 15/group) and 225 (n = 3–6/group) of life. E: Day 80 AUCinsulin. F: Day 80 AUCglucose–to–AUCinsulin ratios. G: Day 225 blood glucose concentrations. H: Day 225 AUCglucose. I: Day 225 AUCglucose–to–AUCinsulin ratio. Data shown as means ± SD and were analyzed with two-tailed unpaired or paired Student t tests. Correlation analyses were performed with Spearman test. *P < 0.05 between groups; **P < 0.01 between groups; ****P < 0.0001 between groups; §P < 0.05 vs. 0 min within the same group; ¶P < 0.05 vs. 15- and 30-min time points within the same group. Veh, vehicle.

