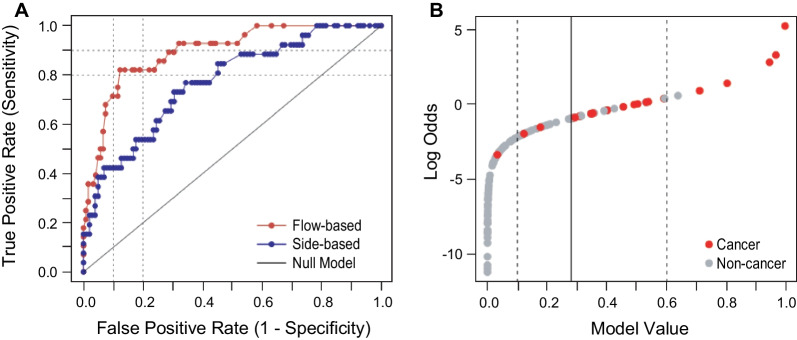
Fig. 7.
CyPath Lung performance on LSRII samples. A Receptor operating characteristic (ROC) curve showing false positive vs true positive rates calculated as the model response threshold was varied (red curve). For comparison, the ROC curve of the previous version of the slide-based CyPath Lung assay [16] is shown in blue. Dashed lines indicate 80% and 90% sensitivity and specificity (1 − False Positive Rate). B Based on the ROC curve in A, a model value (likelihood of cancer) threshold was set at 0.28 (solid vertical line), corresponding to a sensitivity of 82.1% and sensitivity of 87.7%. The dashed lines indicate levels below which a prediction of cancer is very unlikely (leftmost dashed line) or very likely (rightmost dashed line)

