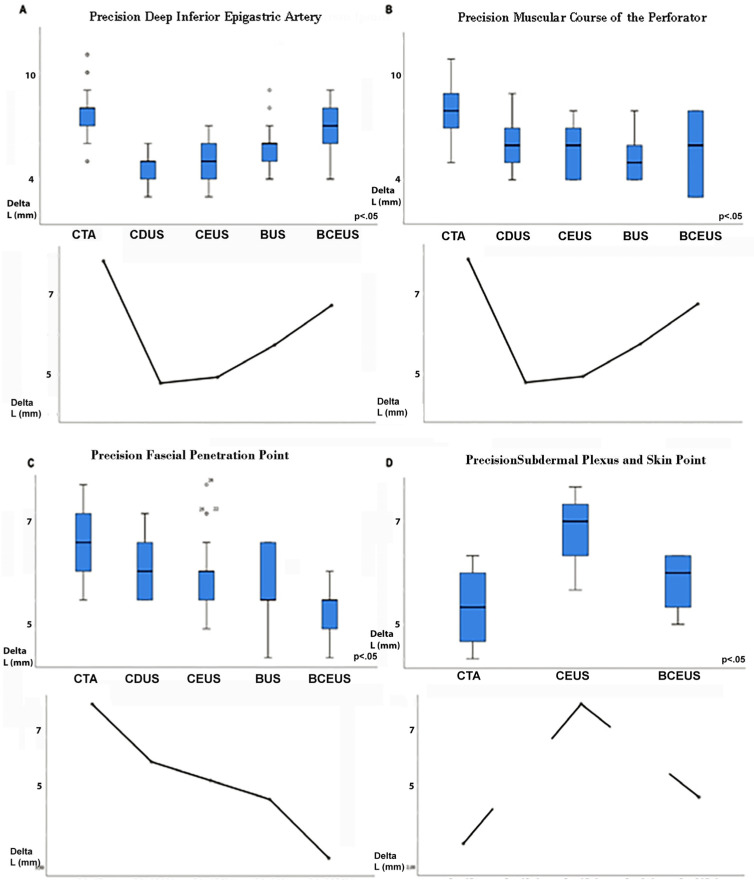
Figure 3.
Figure 3 displays the precision of PM, measured as ∆L (mm), corresponding to the difference between preoperative PM and the actual intraoperative situation. (A) shows the precision of DIEA PM for each imaging mode. (B) displays the precision of M, while (C) displays the precision of F for each mode. (D) clearly shows that only CTA and BCEUS were able to reliably display P and SP.

