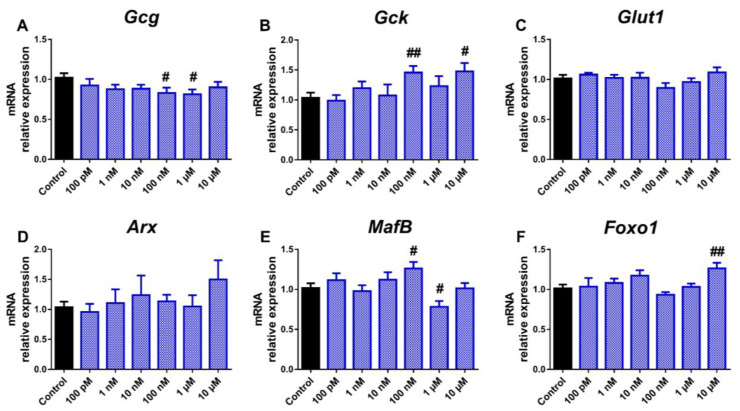
Figure 2.
BPA effects on the expression of genes involved in pancreatic α-cell function and identity. mRNA expression of (A) Gcg, (B) Gck, (C) Glut1, (D) Arx, (E) MafB, and (F) Foxo1 was measured in αTC1-9 cells treated for 24 h with different BPA concentrations (100 pM–10 μM). Data are represented as mean ± SEM of n = 3–4 independent experiments. # vs. Control; # p < 0.05, ## p < 0.01 by the Student’s t test.

