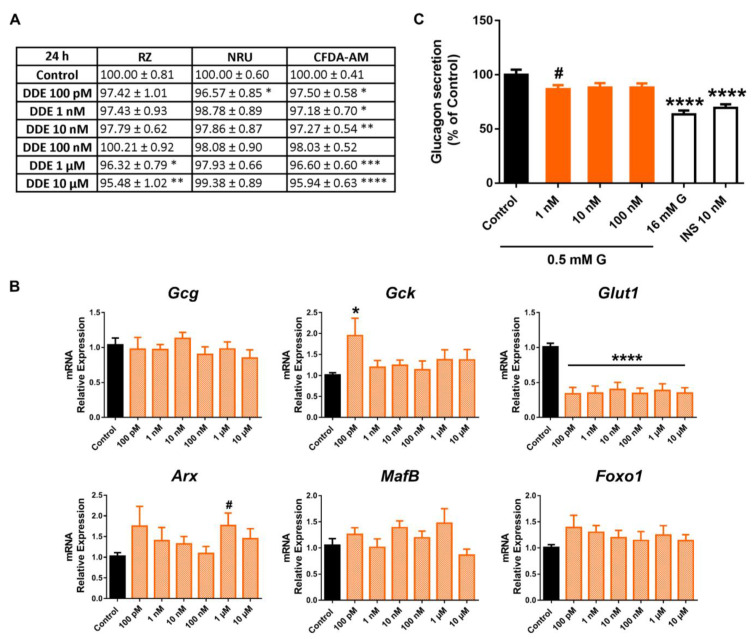
Figure 9.
DDE effects on pancreatic α-cells. (A) Viability of pancreatic αTC1-9 cells treated for 24 h with different concentrations of DDE (100 pM–10 μM) as evaluated by RZ, NRU, and CFDA-AM assays. Results are expressed as % of the solvent controls (Control = 100%). (B) mRNA expression of Gcg, Gck, Glut1, Arx, MafB, and Foxo1 in control- and DDE-treated αTC1-9 cells for 24 h. (C) Glucagon secretion in αTC1-9 cells treated for 24 h with DDE. Data are represented as mean ± SEM of (A) n = 5, (B) n = 3, (C) n = 6 independent experiments. * vs. Control; * p < 0.05, ** p < 0.01, *** p < 0.001, **** p < 0.0001 by one-way ANOVA followed by Dunnett’s post hoc test or Kruskal –Wallis followed by Dunn’s post hoc test. # vs. Control; # p < 0.05 by the Student’s t test.

