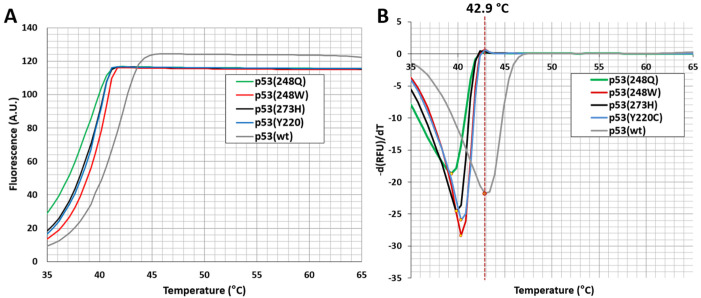
Figure 3.
Analysis of the thermal stability of DNA-binding domains (residues 94–312) of p53 (wild-type) and p53(Y220C), p53(R248Q), p53(R248W) and p53(R273H) mutants by differential scanning fluorimetry. (A) Representative melting curves and (B) derivative curves. Protein (at final concentration of 10 µM) was mixed with SyproOrange fluorescent dye (up to ×10) in 25 mM Hepes buffer pH = 7.2, 150 mM NaCl. Colored curves represent the thermal denaturation patterns of various p53 mutants—p53(Y220C) in light blue, p53(R248Q) in green, p53(R248W) in red and p53(R273H) in black. The red vertical dashed line indicates the Tm of p53 (wild-type) DBD (gray curve). RFU is a relative unit of fluorescence.

