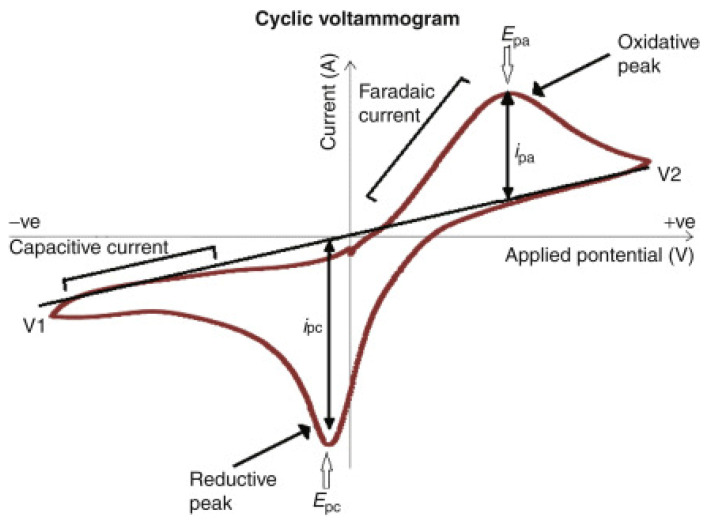
Figure 5.
A schematic diagram of a cyclic voltammogram according to the IUPAC convention: peak cathodic potential (Epc), peak anodic potential (Epa), difference between the cathodic current and the resting current (ipc) and difference between the anodic current and the resting current (ipa) [52].

