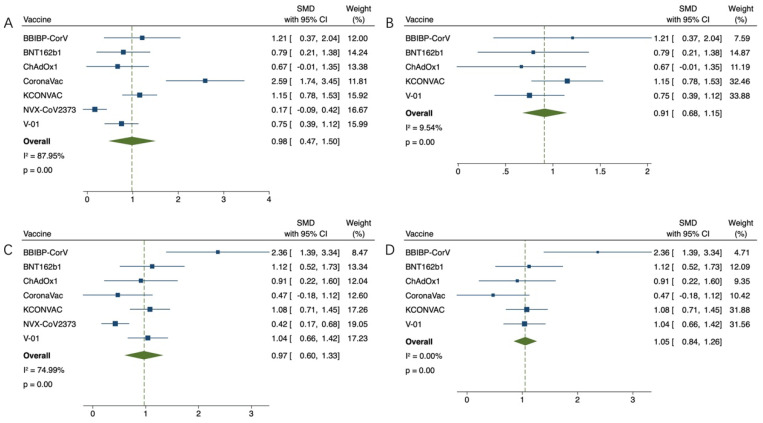
Figure 3.
(A,B) Meta-analysis of the GMT between the experimental group (older adults) and the control group (placebo) after the first vaccination, and results after reducing heterogeneity. (C,D) Meta-analysis of the GMTS of the experimental group (elderly) and the control group (placebo) after the last vaccination, and results after reducing heterogeneity. Blue squares represent effect sizes for a single study, and green rhombus represent pooled results for all studies.

