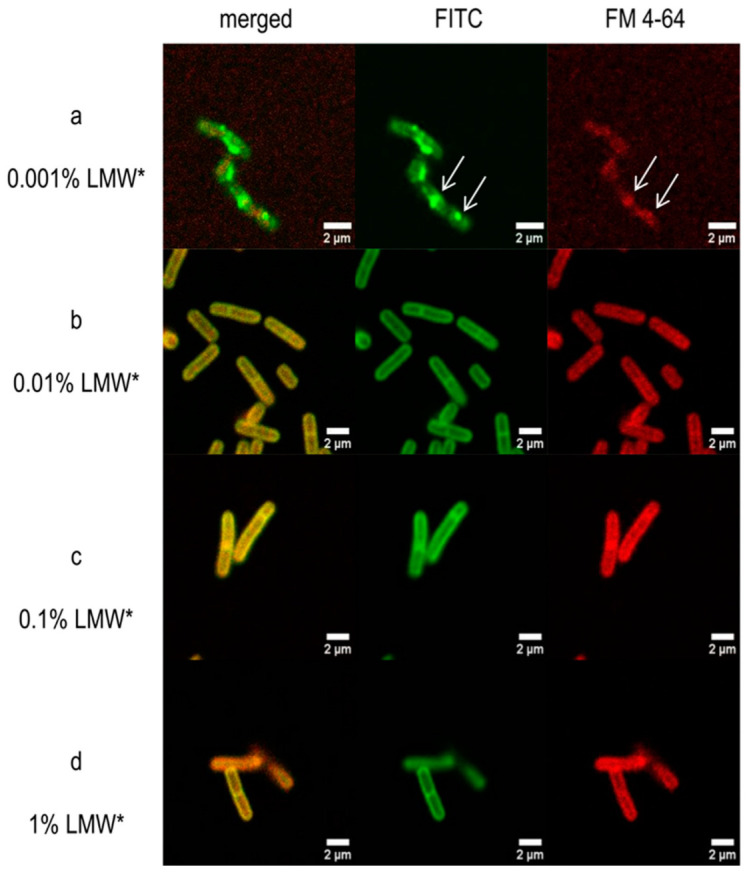
Figure 5.

Confocal microscopic images of L. plantarum after treatment with 0.001% (a), 0.01% (b), 0.1% (c), and 1% FITC labeled LMW chitosan (LMW*) (d). On the second column, the LMW* is shown in green, on the third column the FM® 4–64 dye is shown in red, and on the first column merged channels are demonstrated. White arrows show membrane aggregations.
