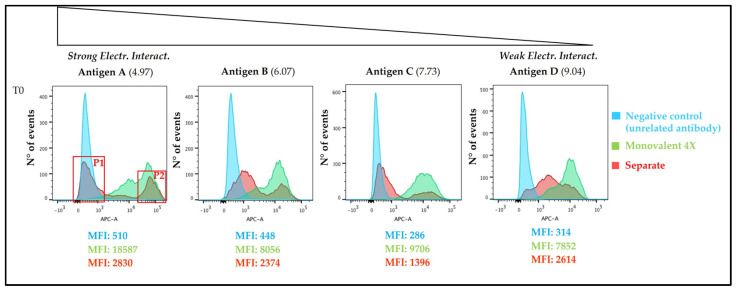
Figure 7.
Fluorescence histogram at T0 of separate formulation approach sample (red) in comparison with negative control (light blue) and monovalent formulation (light green) are reported. On the X axis Fluorescence Intensity is reported, while on the Y axis number of events is reported. All numbers refer to Mean Fluorescence Intensity (MFI) values.

