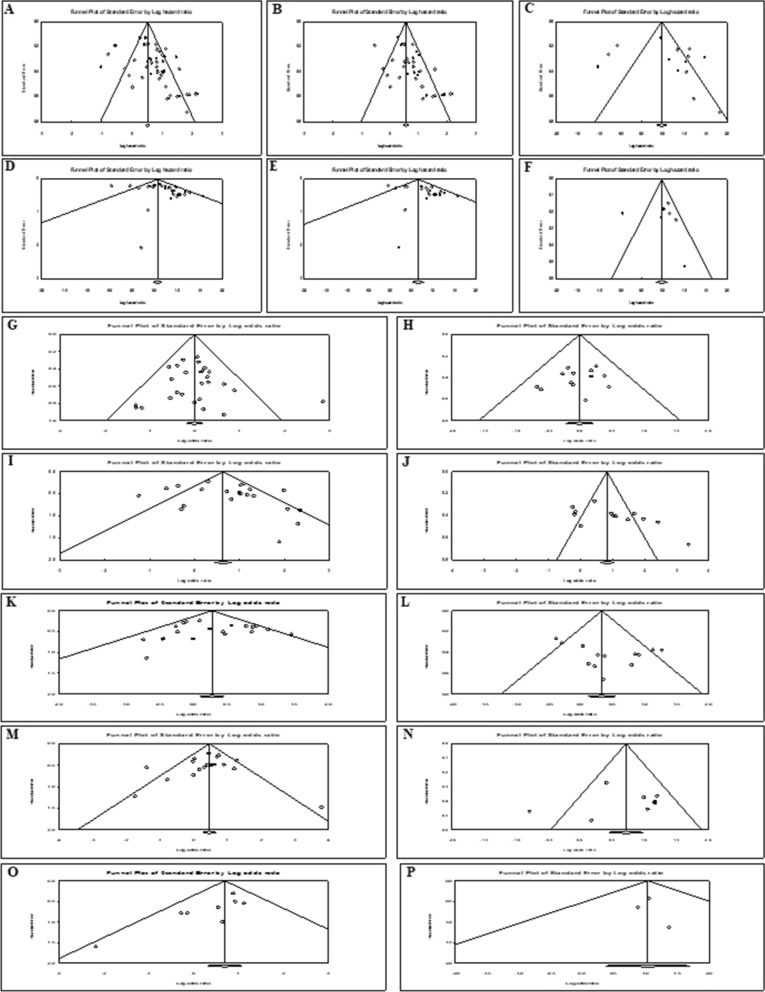
Fig. 7.
Funnel plot of the publication bias. A the association between overall exomiRs deregulation and OS. B, C the association between up-regulated B and down-regulated C exomiRs and OS. D the association between overall exomiRs deregulation and disease/relapse/progression-free survival (DFS/RFS/PFS). E, F the association between up-regulated E and down-regulated F exomiRs and DFS/RFS/PFS. G–P the association between up-regulated and down-regulated exomiRs and clinicopathological characteristics, including gender G, H, TNM stage I, J, Differentiation K, L, Lymph node metastasis M, N, Distant metastasis O, P, respectively

