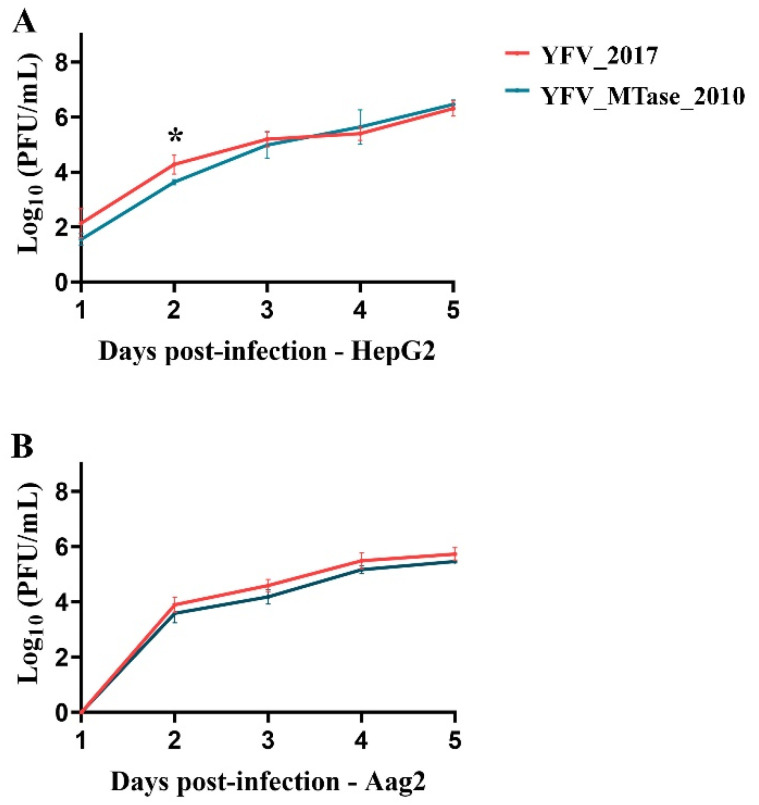
Figure 4.
Viral yields of YFV_2017 and the YFV_MTase_2010 viruses in infected (A) HepG2 cells and (B) Aag2 cells. The viral titers were transformed in log10 and plotted in GraphPad Prism 8. Statistical analyses were applied to each time point using the unpaired t-test to compare viral titers of YFV_2017 and YFV_MTase_2010. The asterisk in (A) represents the statistical significance with p = 0.0361.

