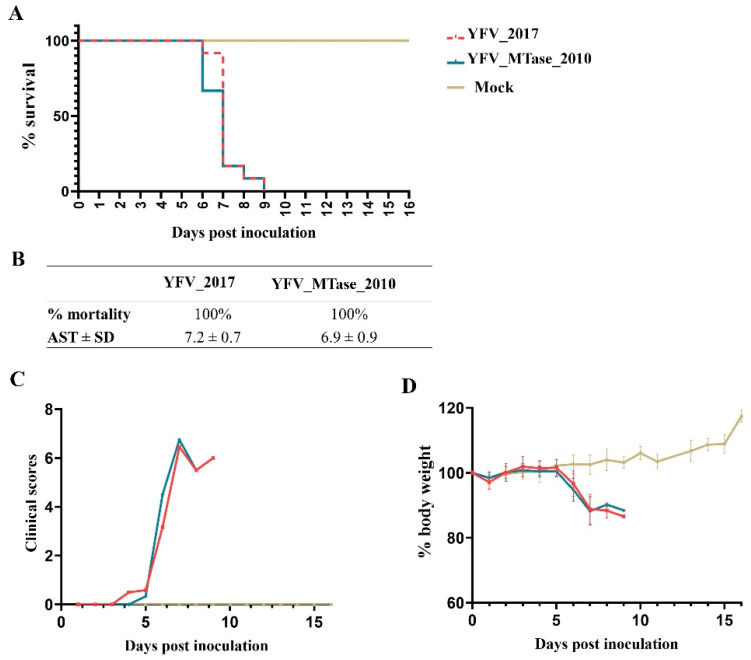
Figure 6.
Neurovirulence in BALB/c mice after inoculation with YFV_2017 and YFV_MTase_2010. (A) Kaplan–Meier survival curves of animal groups inoculated with each virus and culture medium (Mock). (B) Table summarizing the results obtained from the survival curves. (C) Bodyweight measurements during the 16 days after inoculation. (D) Clinical scores of the animals until euthanasia.

