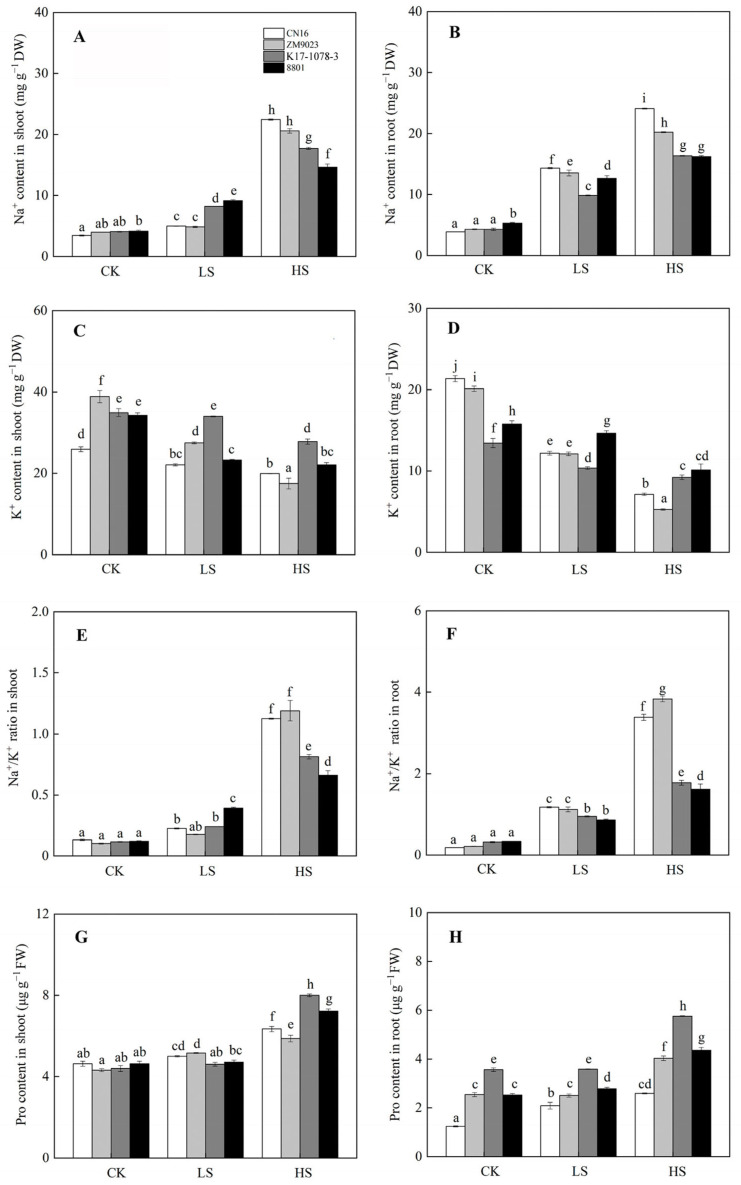
Figure 4.
The Na+ accumulation in shoot (A) and root (B); K+ accumulation in shoot (C) and root (D); Na+/K+ ratio of shoot (E) and root (F); Pro content in shoot (G) and root (H) variations of K17-1078-3 and its parents subjected to different salinity levels. Different letters indicated significant difference due to salt treatments according to Duncan’s multiple range tests. CK, LS, and HS referred to NaCl concentrations of 0, 50, and 200 mM.

