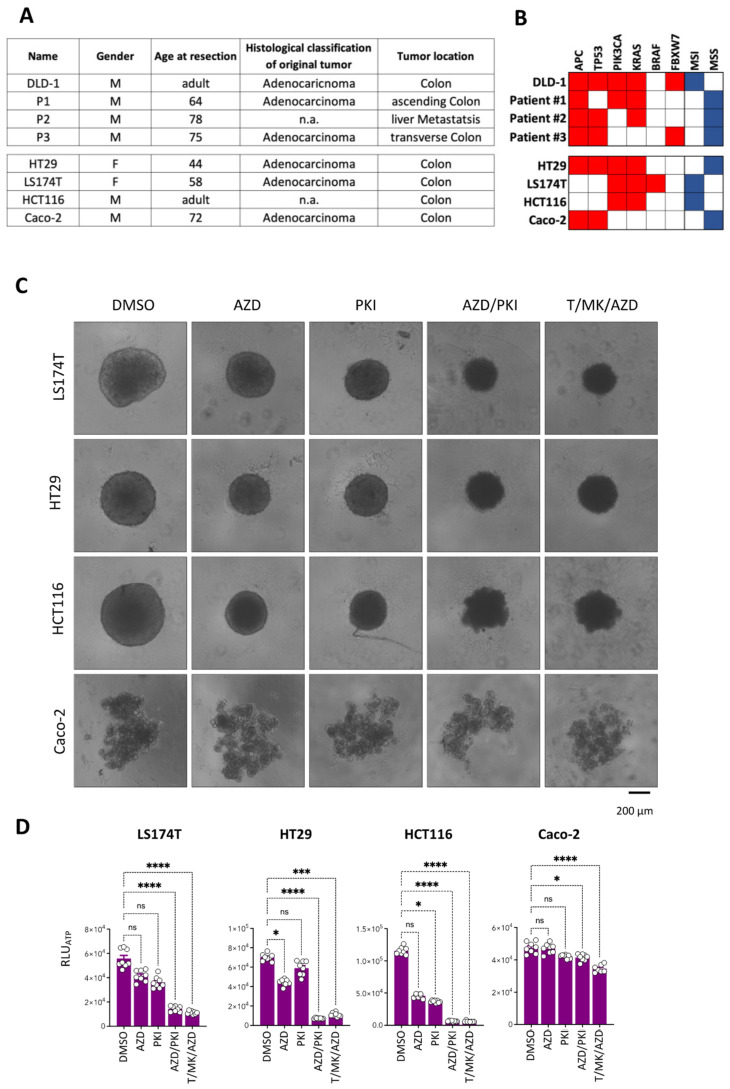
Figure 7.
Treatment response correlates with mutational status in PI3K and/or KRAS. (A) Cell line and patient information. (B) Mutational (red) and microsatellite status (blue) of DLD-1 cells and the tumors from three patients (#1, #2, #3) of the most commonly mutated genes in CRC of which the organoids were derived (top panel). Mutations in other widely used CRC cell lines (bottom panel) used in this study. (C) Representative phase contrast microscopic images of spheroids of the indicated tumor cell lines treated with single inhibitors and combinations for 48 h. DMSO cultures are controls. Scale bar is 200 µm. (D) Cellular ATP levels determined with CellTiter-Glo 3D (CTG3D) after 48 h of spheroid treatment. Luminescence values (RLUATP) were determined (n = 8 per condition). Bar graphs are mean + standard deviation (SD), individual values are shown (circles). p-values are indicated by asterisks.

