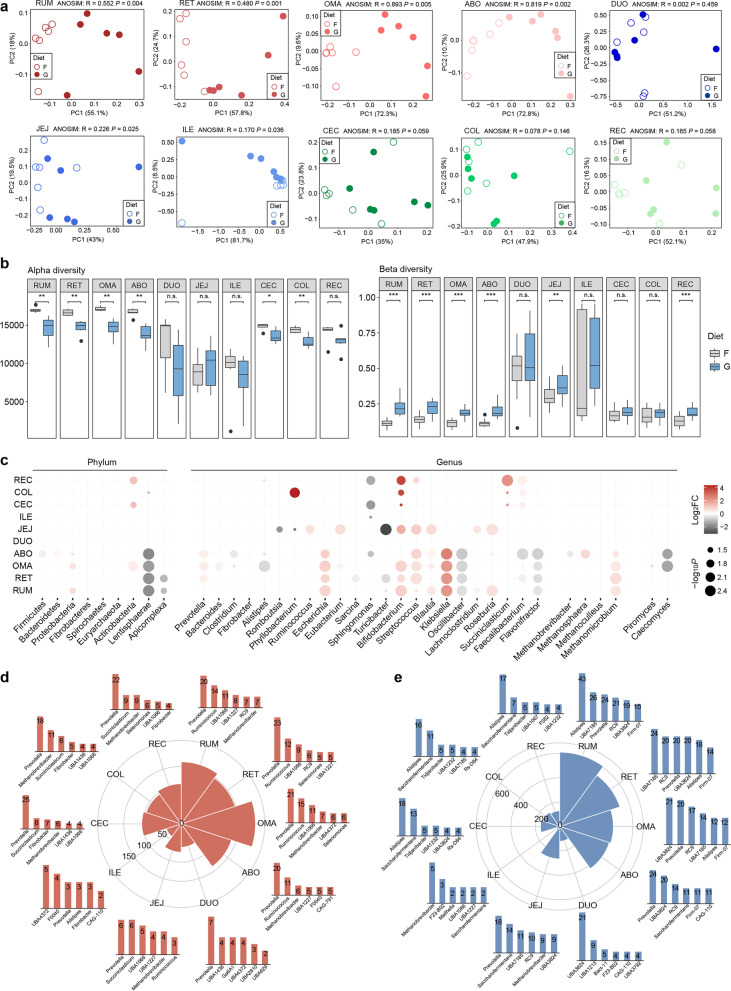
Fig. 6.
a Principal coordinate analysis (PCoA) plot of the gene catalog at the genus level between the forage-based (F) and grain-based (G) diets in each gastrointestinal tract (GIT) region. The differences between groups were assessed using the ANOSIM test based on the Bray–Curtis dissimilarity index. b Comparison of alpha diversity (richness index) and beta diversity (Bray–Curtis) between the F- and G-fed animals, respectively. Significance is based on the relative index of each cohort according to the Wilcoxon rank-sum test. *p < 0.05, **p < 0.01, ***p < 0.001. c The different abundances in dominant taxa at the phylum and genus levels of the bacterial, archaeal, and eukaryotic communities among the GIT regions between the F and G diets. The number and top taxonomic populations of the significantly increased (d) and decreased (e) abundances of SGBs from the proximal to distal GIT (Wilcoxon rank-sum test, log2fold−change > 1 and p < 0.05). The height of the column represents the number of differential SGBs classified into specific genera. RUM, rumen; RET, reticulum; OMA, omasum; ABO, abomasum; DUO, duodenum; JEJ, jejunum; ILE, ileum; CEC, cecum; COL, colon; REC, rectum

