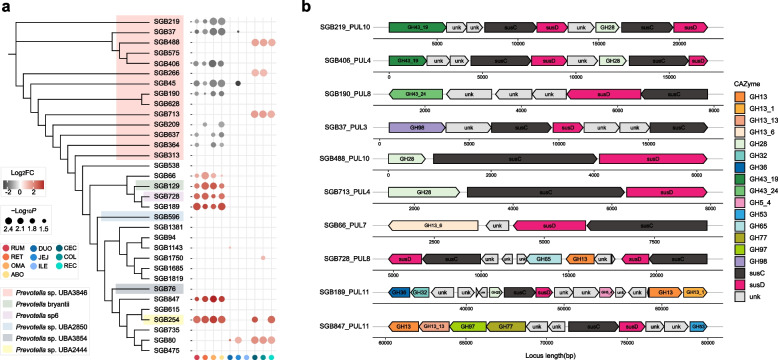
Fig. 7.
Phylogenetic tree of Prevotella-affiliated genomes and its association with polysaccharide utilization loci (PULs) in the distinct diets. a Maximum-likelihood tree of the 33 high-quality Prevotella-affiliated genomes constructed using PhyloPhlAn. The bubble diagram indicates relative changes in the abundance of Prevotella genomes within two diets across the whole gastrointestinal tract (GIT). b Schematic representation of predicted PULs in targeted Prevotella genomes. RUM, rumen; RET, reticulum; OMA, omasum; ABO, abomasum; DUO, duodenum; JEJ, jejunum; ILE, ileum; CEC, cecum; COL, colon; REC, rectum

