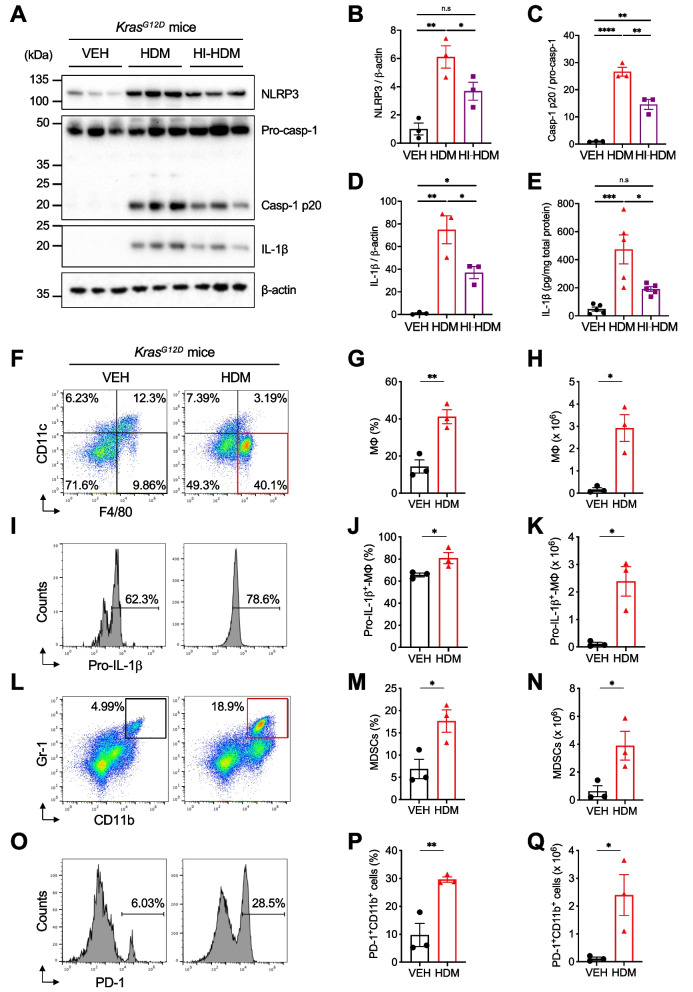
Fig. 3.
HDM activates the NLRP3/IL-1β signaling pathway in the lungs and generates a pro-tumor lung microenvironment. A Lung tissues of KrasG12D mice treated i.n with VEH, HDM, or HI-HDM, as shown in Fig. 2A, were homogenized for western blot analysis of NLRP3, caspase-1, IL-1β, and β-actin expression (n = 3 mice/group). Blots are representative of at least 3 independent experiments. B Densitometric measurements of NLRP3, C) caspase-1 p20 and D) IL-1β, relative to β-actin (B and D) or pro-caspase-1 (C) in the blots shown in A. E) ELISA analysis of IL-1β production in lung tissue homogenates as in A (n = 5 mice/group). F-I The lungs of KrasG12D mice treated i.n with VEH or HDM as shown in Supplemental Fig. 2A were harvested on day 61 (24 h after the last i.n treatment) and single-cell suspensions were prepared for flow cytometry analyses. F Representative dot plots of macrophages (MΦ) identified as CD11b+CD11c–F4/80+ cells (see Supplemental Fig. 3A for gating strategy). G Frequencies and H) absolute numbers of MΦ as shown in F. I) Representative histograms showing intracellular levels of pro-IL-1β in MΦ gated as in F. J) Frequencies and K) absolute numbers of pro-IL-1β+-MΦ as shown in I. L Representative dot plots of MDSCs (identified as CD11b+Gr-1hi cells). M Frequencies and N) absolute numbers of MDSCs as shown in L. O Representative histograms showing PD-1 expression levels on CD11b+ cells (see Supplemental Fig. 3A for gating strategy). P Frequencies and Q) absolute numbers of PD-1+CD11b.+ cells as shown in O. Data are representative of one (F–Q) or two (A–E) independent experiments and are presented as mean ± SEM. Statistical significance was assessed by one-way ANOVA with post hoc Bonferroni’s test (A-E) or two-tailed Student’s t-test (F-Q). n.s: non-significant, * P < 0.05, ** P < 0.01, *** P < 0.001

