Figure 1.
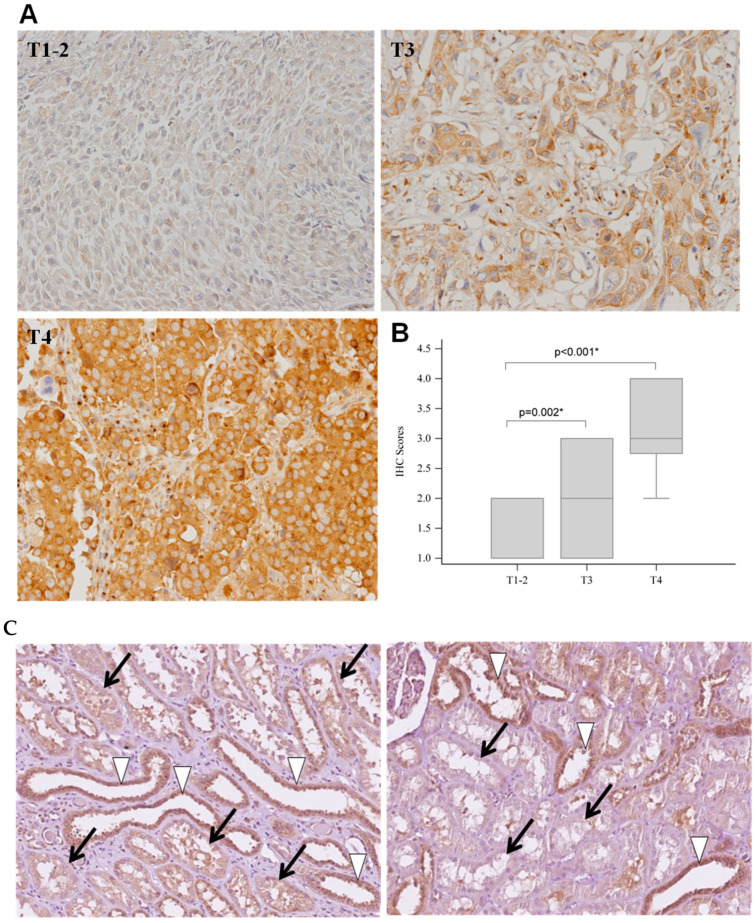
Up-regulation of FGFR3 in renal pelvis tissues from Caucasian patients with urothelial carcinoma. Tissue microarray slides containing sections from Caucasian patients with renal pelvis urothelial carcinoma at stages T1–2 (n = 62), T3 (n = 17), and T4 (n = 5) were subjected to immunohistochemistry (IHC) staining with FGFR3. (A) Representative FGFR3-positive stained images from stages T1–2, T3, and T4. (B) Quantification of FGFR3 expression levels from IHC staining results (scores were from 1 to 4). Data are shown in box plots displaying 25% to 75% percentile. * indicates significance between the indicated groups. (C) Heterogeneous distribution of FGFR3 in normal renal tubular epithelium. Note that proximal renal tubules (black arrows) usually show weak FGFR3 expression (score 1+), while distal tubules (white arrowheads) in the same specimen likely display stronger FGFR3 signals (score 2+~3+).

