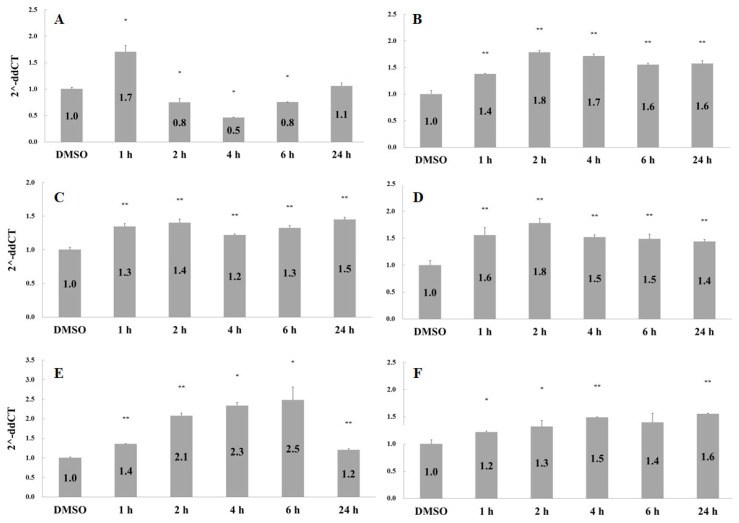
Figure 4.
Effects of catechu extracts on gene expression. HMEC-1 cells were treated with 0.1 ng/mL of catechu extracts for 1, 2, 4, 6, and 24 h. The gene expression levels for (A) IL-8, (B) FGFR2, (C) FGFR3, (D) NF-kB, (E) STAT3, and (F) vimentin were examined by quantitative PCR. Data are presented as means ± SD in three independent experiments. The p-value was calculated versus the control. Using one-tailed test analysis, * indicates p < 0.05 and ** indicates p < 0.005 between different times after catechu treatment. The DMSO group was the solvent control.

