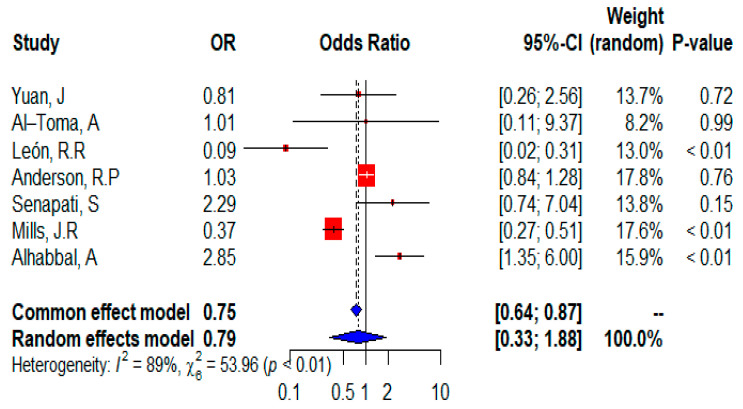
Figure 7.
Forest plot of CD risk analysis in adult patients with heterozygous HLADQ8 allele. Abbreviations: CI, confidence interval. Data sources are shown in Table 2. In the forest plot the contribution of each study to the meta-analysis (its weight) is represented by the area of a box whose center represents the size of the odds ratio (OR) estimated from that study (point estimate). The 95% confidence interval (CI) for the OR from each study is also shown. The summary OR is shown by the middle of a diamond whose left and right extremes represent the corresponding CI.

