Figure 1.
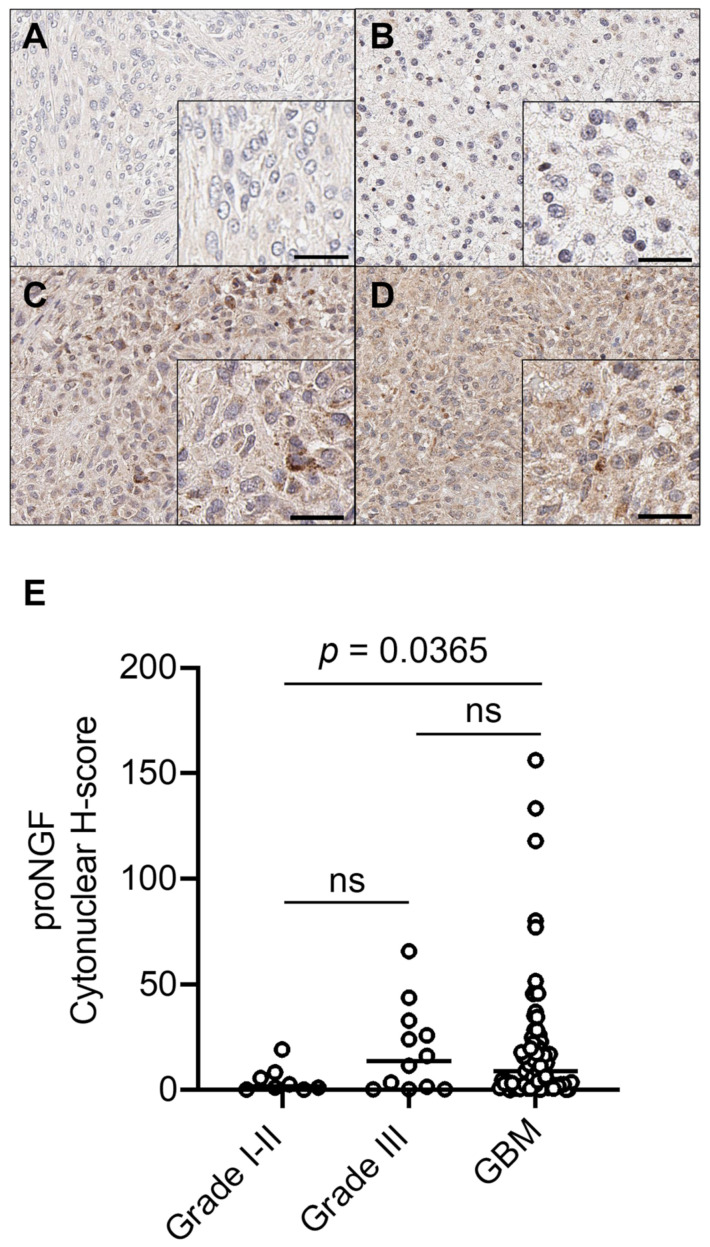
ProNGF expression in GBM vs. low grade gliomas. Immunohistochemical detection of proNGF, representative pictures are shown for (A) grade I, (B) grade II, (C) grade III gliomas, and (D) GBM. (E) Digital quantification of proNGF staining intensities according to grouped pathological subtypes: grade I–II (h-score = 1.98, IQR 0.50–7.73), grade III (h-score = 13.93, IQR 0.74–31.15) and GBM (h-score = 9.05, IQR 2.63–22.31). Scale bar = 30 µm. Data are expressed as individual values with medians. H-score distributions were compared using the Wilcoxon rank-sum (dichotomous) or Kruskal–Wallis (multiple comparisons) tests. Mann-Whitney test was used to evaluate the proNGF h-score median difference between grades I–II and GBM, and grade III and GBM.

