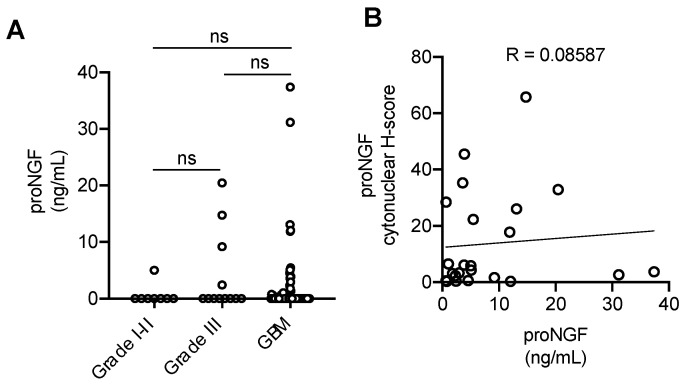
Figure 2.
Plasma concentration of proNGF in GBM vs. low grade gliomas (A). ProNGF plasma quantifications were obtained by ELISA in plasma from grade I–II and grade III gliomas vs. GBM patients. ProNGF concentrations are represented in ng/mL. The mean proNGF concentration was 1.99 ng/mL (95% CI, 0.55–3.44) in GBM samples versus 3.90 ng/mL (95% CI, 0.56–8.36) in grade III and 0.6266 ng/mL (95% CI, 0–2.11) in grades I–II combined. Concentration distributions were compared using the Wilcoxon rank-sum (dichotomous) or Kruskal–Wallis (multiple comparisons) tests. Student’s t-test was used to evaluate the mean difference in plasma proNGF between grades I–II gliomas vs. GBM, and grade III gliomas vs. GBM. (B) Correlation analysis of patients positive for proNGF in plasma and IHC h-score.

