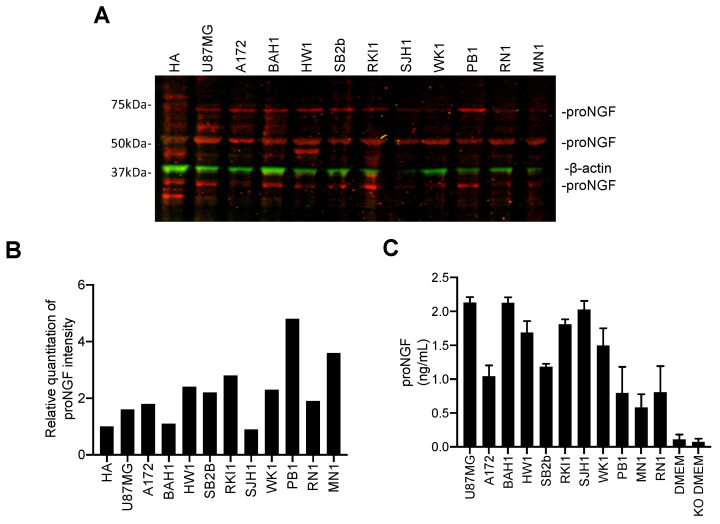
Figure 3.
ProNGF protein expression in a panel of GBM cell lines. (A) Western blotting for proNGF was performed with cellular proteins extracted from HA (non-tumorigenic human astrocytes) cells and the following human GBM cell lines: U87MG, A172, BAH1, HW1, SB2b, RKI1, SJH1, WK1, PB1, RN1 and MN1. ProNGF was detected as 35, 55 and 75 kDa bands in all cell lines. (B) Densitometric analysis of the combined signal intensity obtained from the 3 proNGF bands. (C) ProNGF secretion was quantified by ELISA in conditioned medium of GBM cell lines. ProNGF concentrations are represented in ng/mL. Data shown are the mean ± SD of three independent experiments. DMEM: medium for U87MG and A172; KO DMEM: medium for all of the patient-derived GBM cells.

