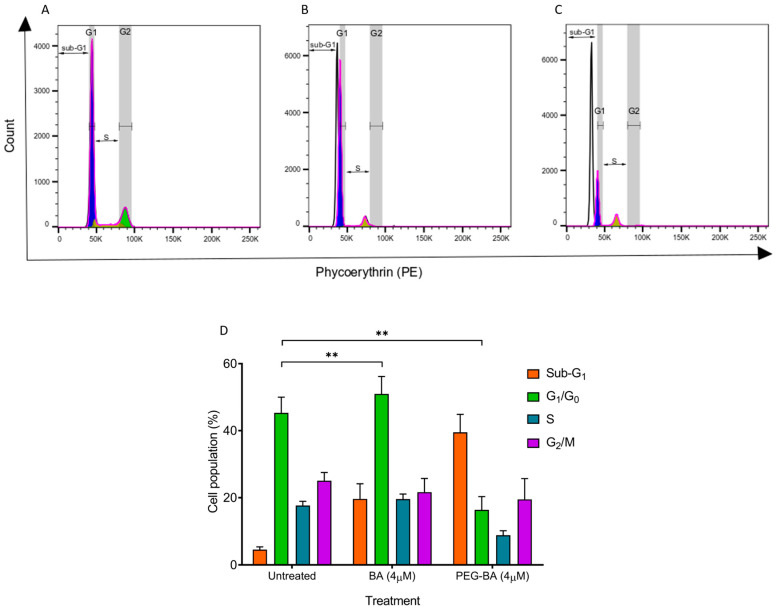
Figure 2.
The cell cycle status was monitored using propidium iodide after 72 h of treatment. (A–C) Representative histograms showing the different phases of the cell cycle indicated by the white (sub-G1), purple (G1/G0), yellow (S) and green (G2/M) peaks. Double-sided arrows were inserted to highlight the sub-G1 and S phases. Overall, both BA and PEG-BA resulted in a shift of cells from the G1/G0 to the sub-G1 phase, indicating apoptosis induction. (D) Quantitative plots representing the overall cycling status of the PC cells (mean ± SEM), n = 3, **: p < 0.01. The Inkscape software (Version 1.1) was used to edit Figure 2A–C for clarity.

