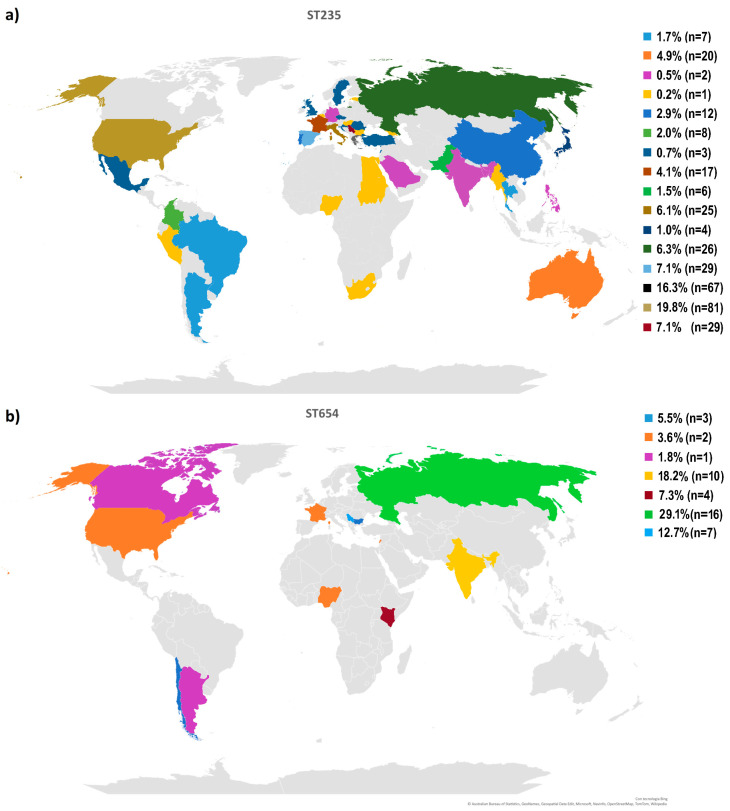
Figure 3.
Geographical distribution of the Pseudomonas aeruginosa ST235 (a) and ST654 (b) high-risk clones based on the data available in the Pseudomonas Genome Database (Date accessed 2 January 2023). Colors represent the percentage of clones ST235 and ST654 among isolates of P. aeruginosa within a country, as indicated in the geographic map.

