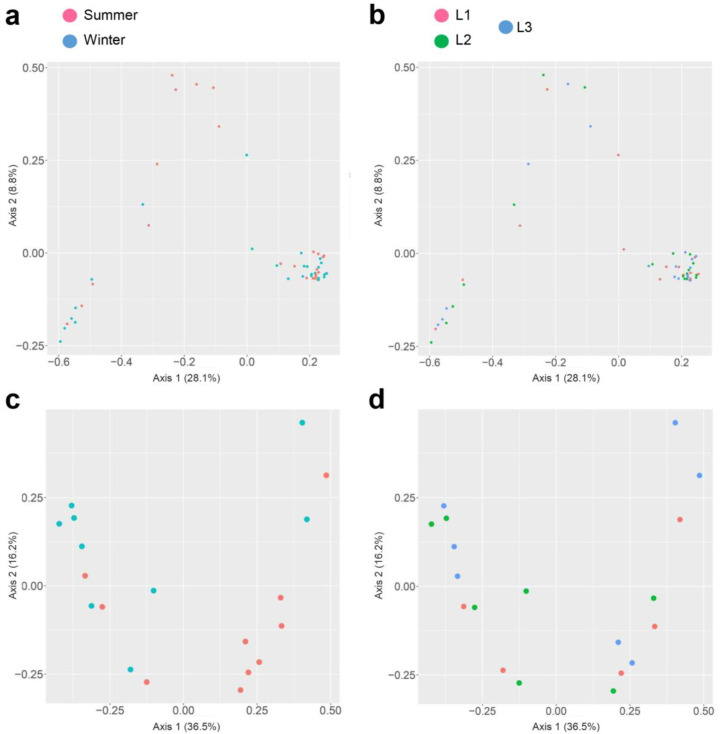
Figure 6.
Principal Coordinate Analysis (PCoA) plot of the beta diversity distances obtained from the unweighted UNIFRAC analysis of Observation, Shannon index, and Simpson index. PCoA of 16S rRNA sequences based on season (a), distances (b), and PCoA of 18S rRNA sequences based on season (c) and distances (d).

