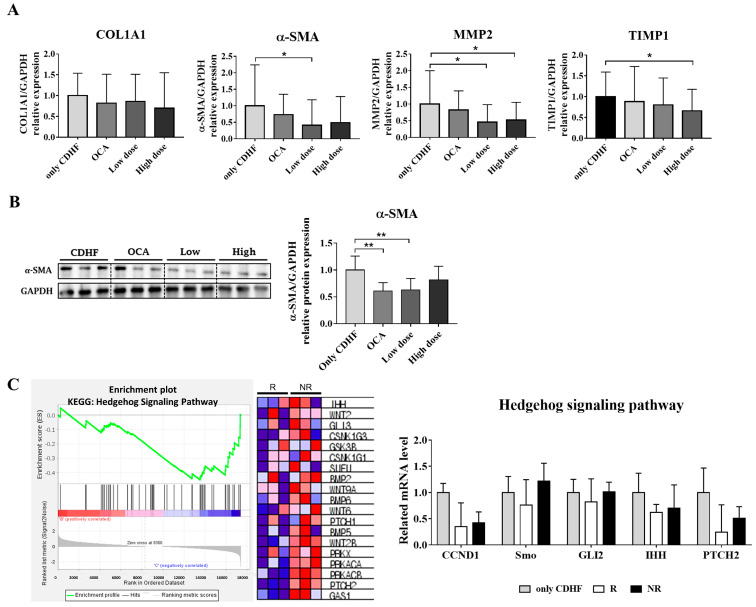
Figure 3.
Effect of ALS-L1023 on the mRNA and protein expression of fibrosis markers, and the transcriptomic analysis for further verification. (A) mRNA expression of fibrosis markers in liver tissue. (B) protein expression of fibrosis marker in liver tissue. (C) Gene Set Enrichment Analysis and expression of related genes in the hedgehog-signaling pathway. Data are presented as mean ± standard deviation and were analyzed by Mann-Whitney U test. * p < 0.05, ** p < 0.01 compared to the choline-deficient high-fat (CDHF) group. Obeticholic acid (OCA) was used as a positive control. In the heat map, expression values are represented as the range of colors (red, pink, light blue, dark blue) that shows the range of expression values (high, moderate, low, lowest).

