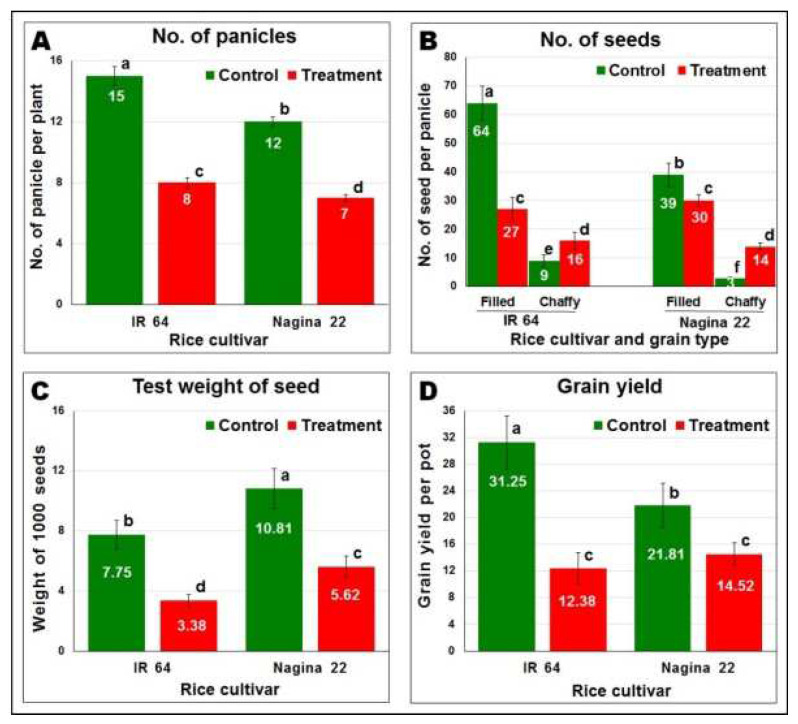
Figure 4.
Effect of drought stress on agronomic performance of the rice cultivar. (A) Number of panicles per pot, (B) grain quality, (C) test weight of seed, (D) grain yield per pot. Data present mean value (n = 3) and the mean followed by different lower-case letters are significantly different (p ≤ 0.05). The error bar represents the Standard Deviation (±SD).

