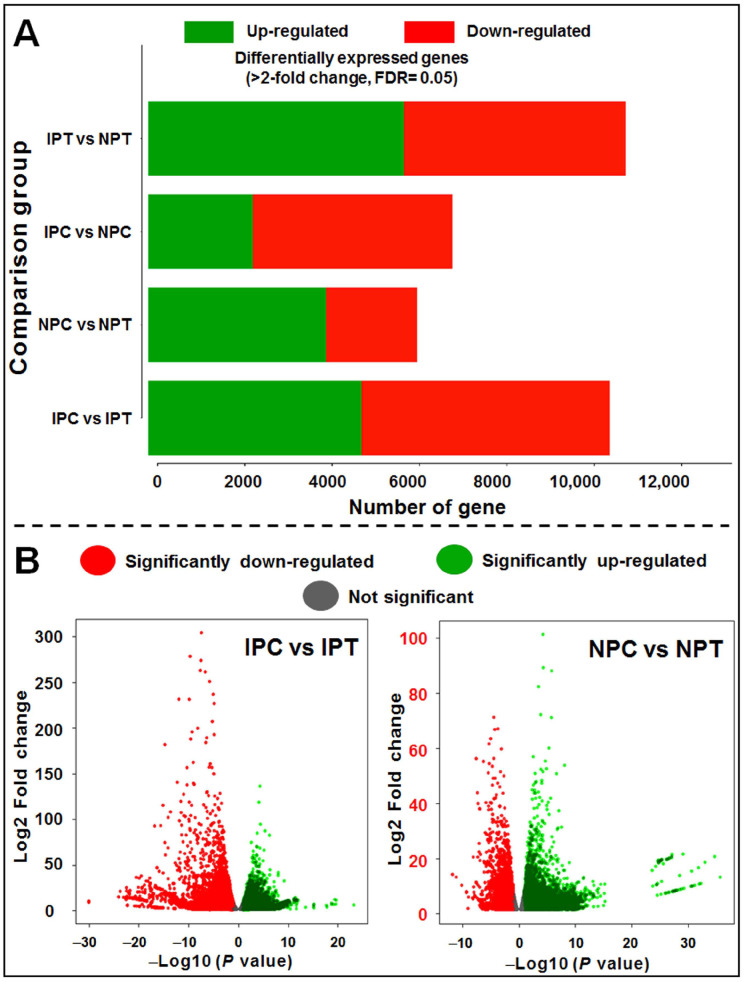
Figure 7.
Differentially expressed genes (DEGs) in pairwise comparison with >2-fold change and FDR ≤ 0.05. (A) Bar graph depicting significantly up- and downregulated genes in four different comparison groups, (B) volcano plots showing the expression pattern of DEGs in control vs. treated panicle. IPC = IR 64, panicle, control; IPT = IR 64, panicle, treatment (drought); NPC = Nagina 22, panicle, control; NPT = Nagina 22, panicle, treatment.

