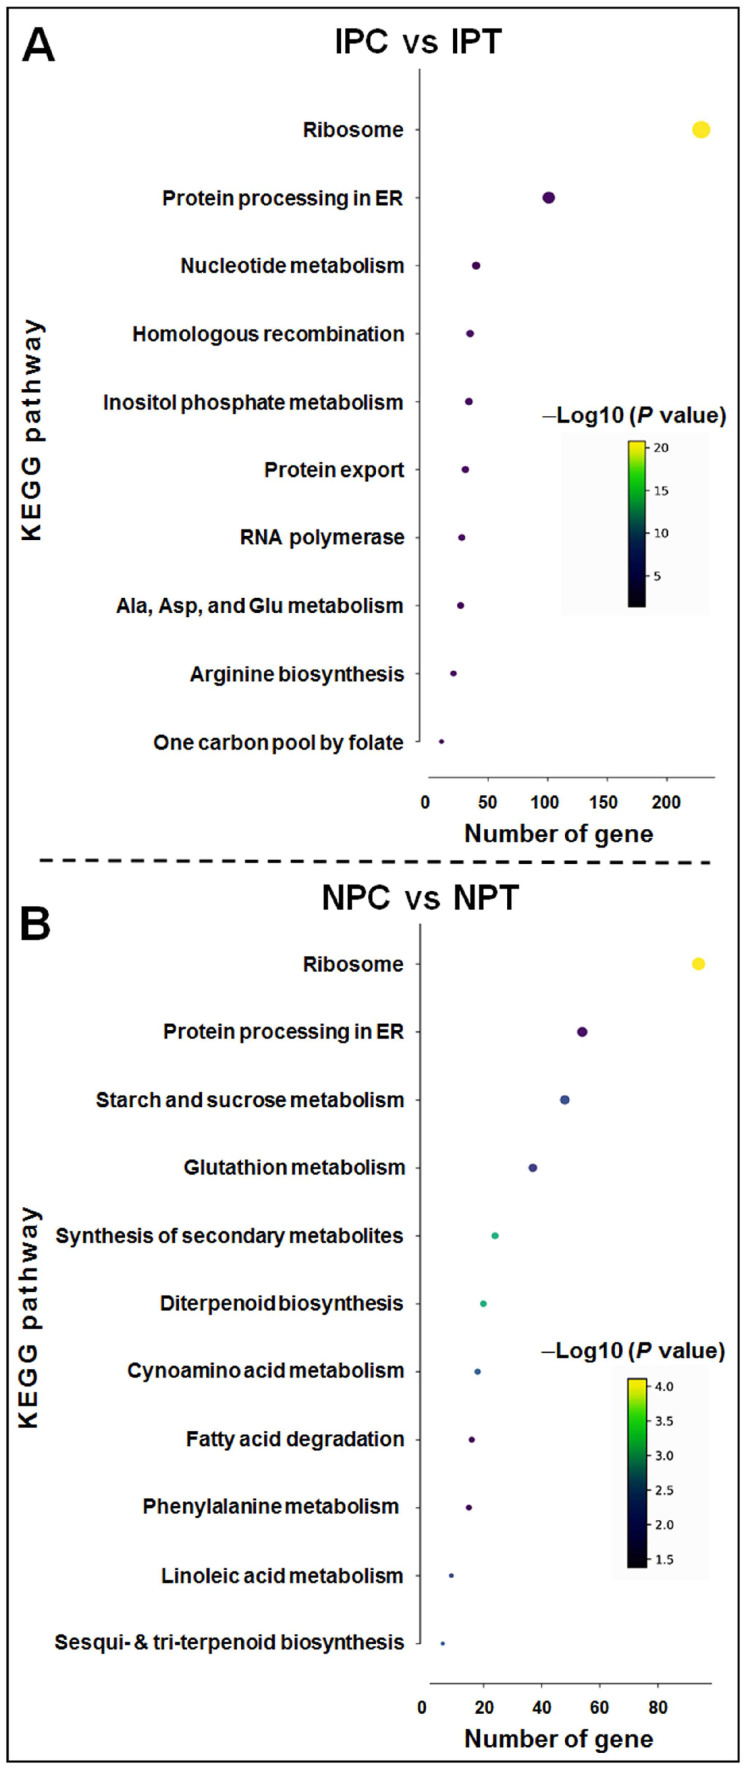
Figure 10.
Kyoto Encyclopedia of Genes and Genomes (KEGG) pathway enrichment analysis in panicle of the contrasting rice cultivars in response to reproductive-stage drought stress. (A) IPC vs. IPT, (B) NPC vs. NPT. Only the top 20 enriched pathways based on enrichment score [−Log10 (p value)] are presented. IPC = IR 64, panicle, control; IPT = IR 64, panicle, treatment (drought); NPC = Nagina 22, panicle, control; NPT = Nagina 22, panicle, treatment. The color of the dot depicts the enrichment score of the pathway, while the size of the dot represents the gene count for the pathway.

