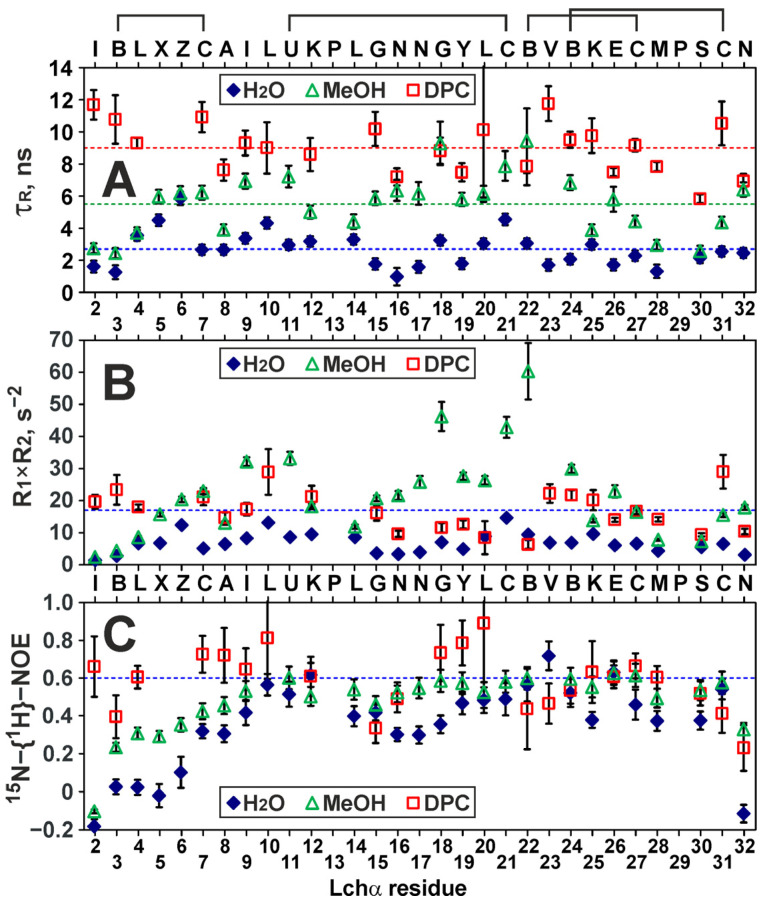
Figure 5.
15N relaxation measurements at 80 MHz revealed the dynamic properties of Lchα in water, methanol, and DPC micelles. (A) The apparent rotational correlation times were calculated from the R2/R1 ratio. The levels corresponding to the average values (2.7, 5.5, 9.0 ns, respectively) are shown by broken lines. (B) Calculated R1×R2 products. The residues displaying R1 × R2 > 17 s−2 are subjected to exchange fluctuations on the μs–ms time scale [42]. (C) Steady-state 15N-{1H}-NOE. The residues displaying NOE < 0.6 are subjected to extensive motions on the ps–ns time scale. The data in the figure represent the results obtained from one series of NMR experiments. Each NMR experiment includes multiple signal averaging. Error bars correspond to experimental errors estimated from the noise level in the spectra.

