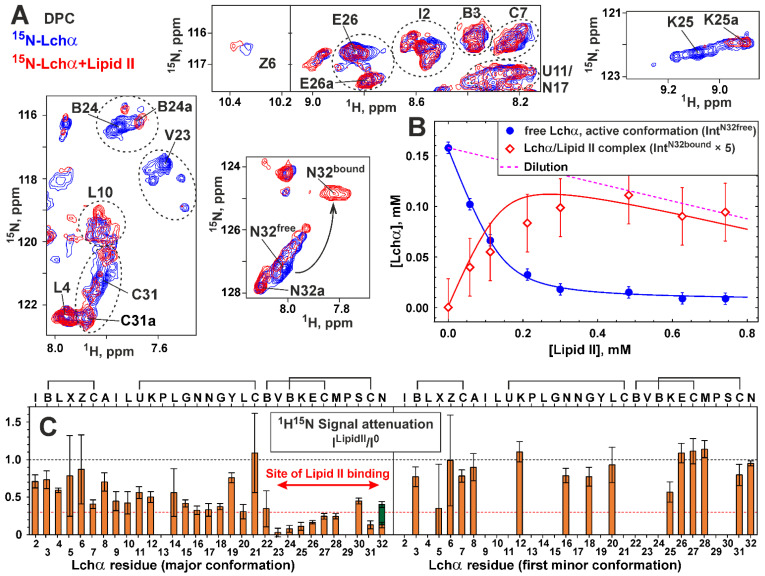
Figure 6.
NMR data defines the lipid II binding to Lchα in the DPC micelles environment. (A) Fragments of 2D 15N-HSQC spectra of Lchα (0.3 mM, pH 5.8, 45 °C) measured in the absence (blue contours) and the presence of 4:1 molar excess of lipid II (red contours). The signals of the first minor form are labeled with “a”. The residue names are given in the one letter code format (see caption to Figure 3). Corresponding fragments of the 15N-HSQC spectrum are highlighted by rectangles in Figure 3C. (B) Curves describing lipid II binding to Lchα. Blue circles/curve—concentration of the active conformation of Lchα non-bound to lipid II determined from the intensity of Asn32free 1H15N signal and approximated by the binding model (Equation (3)). Red curve—concentration of the Lchα/lipid II complex determined from the fitted binding model. Red diamonds—concentration of the Lchα/lipid II complex determined from the intensity of Asn32bound 1H15N signal. Intensity of Asn32bound signal was increased fivefold to account for the difference in relaxation. (C) Attenuation of 1H-15N-HSQC signals of the major and minor Lchα forms induced by addition of 4:1 molar excess of lipid II. The 0.3 threshold line subdivides data points in two groups: the residues interacting with lipid II (below) and not (above). Two bars are shown for Asn32 residue corresponding to Asn32free (orange) and Asn32bound (dark green) signals. Sample dilution is taken into account. The data in the figure represent the results obtained from one series of NMR experiments. Each NMR experiment includes multiple signal averaging. Error bars correspond to experimental errors estimated from the noise level in the spectra.

