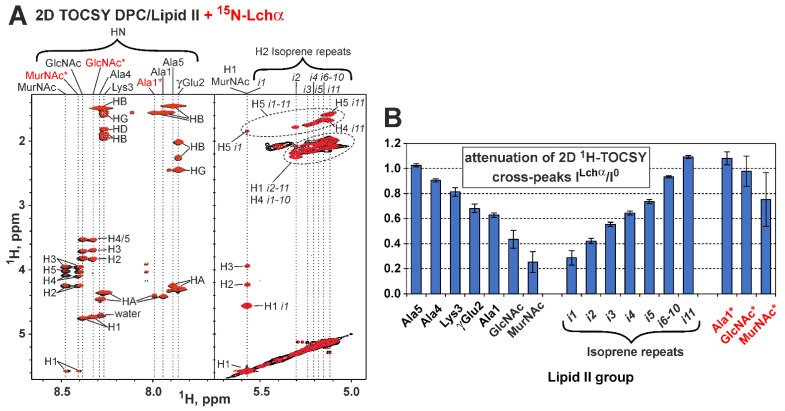
Figure 7.
NMR data defines the Lchα binding to lipid II in the DPC micelles environment. (A) Fragments of 2D 1H-TOCSY spectra of lipid II (pH 5.8, 45 °C) measured in the absence (black contours) and the presence of Lchα (red contours, lipid II/Lchα = 4:1). Isoprene repeats are labeled as in Figure 1F (i1 is connected to pyrophosphate). The signals of the impurity (GlcNAc-MurNAc-pentapeptide) are labeled with “*”. (B) Attenuation of 1H-TOCSY signals of the lipid II and impurity induced by addition of Lchα. The strongest TOCSY cross-peak (in the vertical direction) for each HN or H2 resonances (horizontal direction) was taken for analysis. The data represent the results obtained from one series of NMR experiments. Each NMR experiment includes multiple signal averaging. Error bars correspond to experimental errors estimated from the noise level in the spectra.

