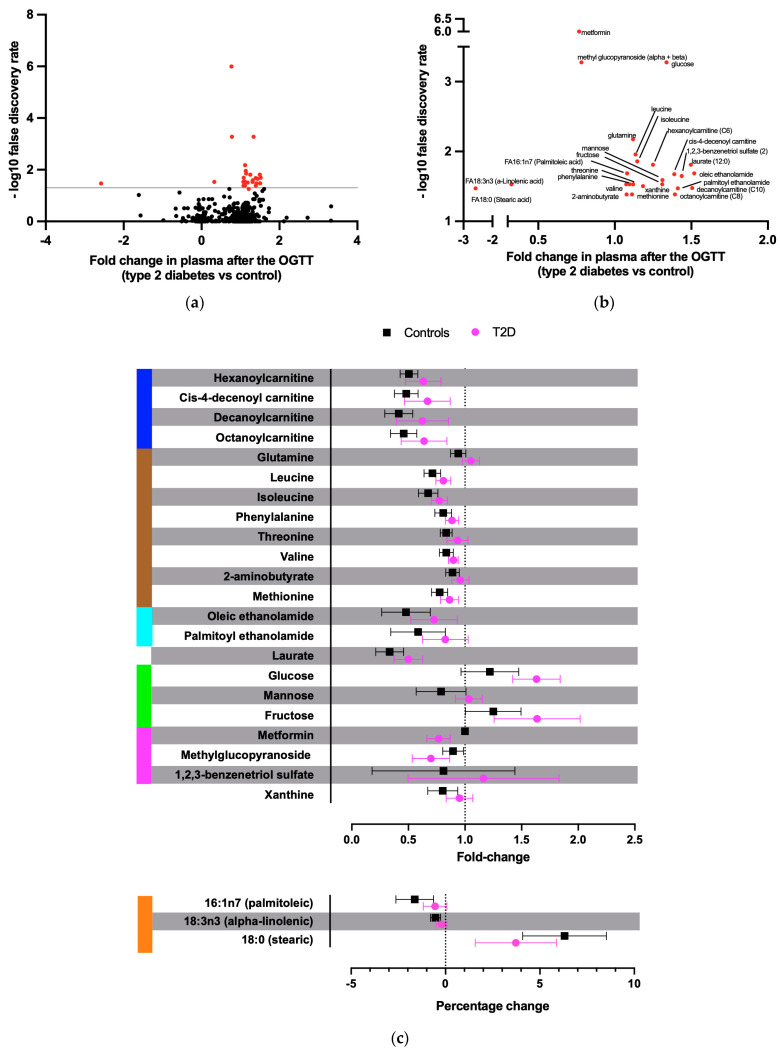
Figure 1.
Metabolites with a significantly different fold change after the OGTT between T2D and control subjects. (a) Volcano plot of the differences in plasma metabolite concentration changes 90 min after 75 g glucose ingestion between patients with T2D and controls. Y-axis shows –log10 false discovery rate. Red dots depict significant results. (b) Zoom-out on the significant metabolites from panel (a). (c) Fold and percentage changes of the significant metabolites after the OGTT for T2D and control subjects. In blue, acylcarnitines; in brown, amino acids; in light blue, acyl ethanolamides; in green, monosaccharides; in magenta, xenobiotics; in orange, free fatty acids.

