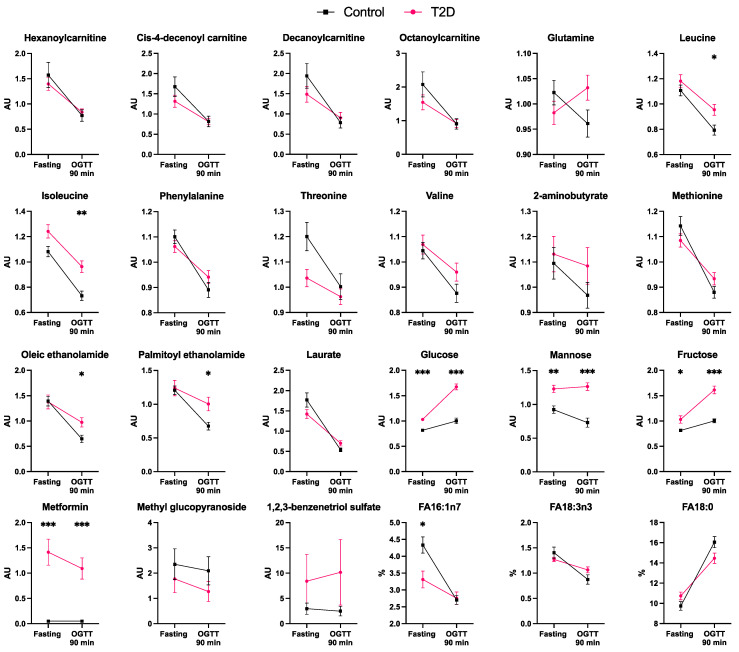
Figure 2.
Fasting and 90 min post-OGTT plasma levels of the metabolites that significantly differ in response to the OGTT between control and T2D subjects (n = 20 per each group). FA16:1n7: palmitoleic acid. FA18:0: stearic acid. FA18:3n3: alpha-linoleic acid. Data are presented as mean ± SEM. AU, arbitrary units. %, percentage of the free fatty acid family total concentration. * p < 0.05, ** p < 0.01, *** p < 0.001 for differences between controls and T2D individuals (Mann–Whitney tests).

