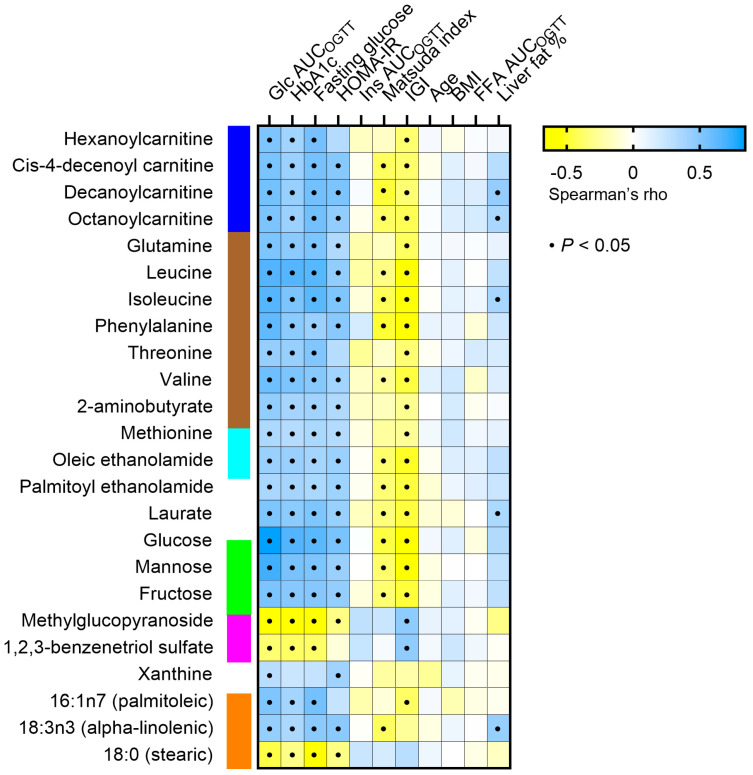
Figure 4.
Correlation matrix between plasma concentration change of metabolites that significantly differ in response to the OGTT between controls and T2D individuals (rows) and several clinical parameters (columns). A black dot indicates a statistically significant correlation between the respective metabolite and parameter (p < 0.05). Glc AUCOGTT: glucose area under the curve during the OGTT. HbA1c, glycosylated hemoglobin. Ins AUCOGTT: insulin area under the curve during the OGTT. IGI: insulinogenic index. FFA: free fatty acid. In blue, acylcarnitines; in brown, amino acids; in light blue, acyl ethanolamides; in green, monosaccharides; in magenta, xenobiotics; in orange, free fatty acids.

