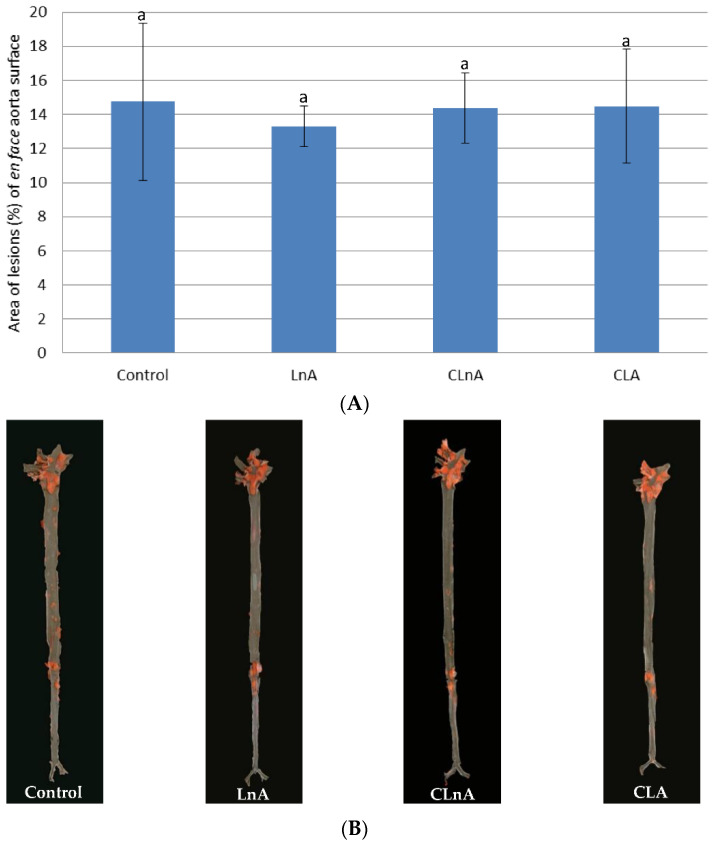
Figure 4.
(A) Quantification (% area) of atherosclerotic plaque in entire aorta (en face) in apoE/LDLR−/− mice (n = 10) fed experimental diets in LONG. Values are means with their standard errors depicted by vertical bars. The means marked with letters a are not significantly different (p < 0.05). (B) Representative images of en face aorta showing atherosclerotic plaque in apoE/LDLR−/− mice (n = 10) fed experimental diets in LONG.

