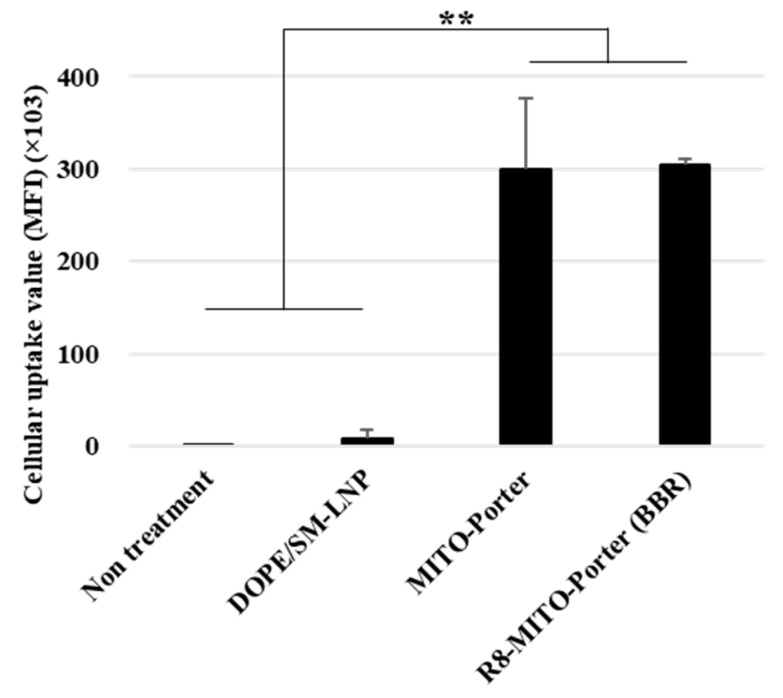
Figure 2.
Evaluation of cellular uptake of LNPs. Cellular uptake of LNPs into Neuro2a cells was evaluated based on MFI using a FACS. The LNPs were labeled with DiD, a fluorescent dye, and the cells were analyzed after the LNP treatment. Data are represented as the mean ± S.D. (n = 3). ** p < 0.01, one-way ANOVA followed by Student–Newman–Keuls test.

